This document describes how to use Pasco Capstone for video analysis.
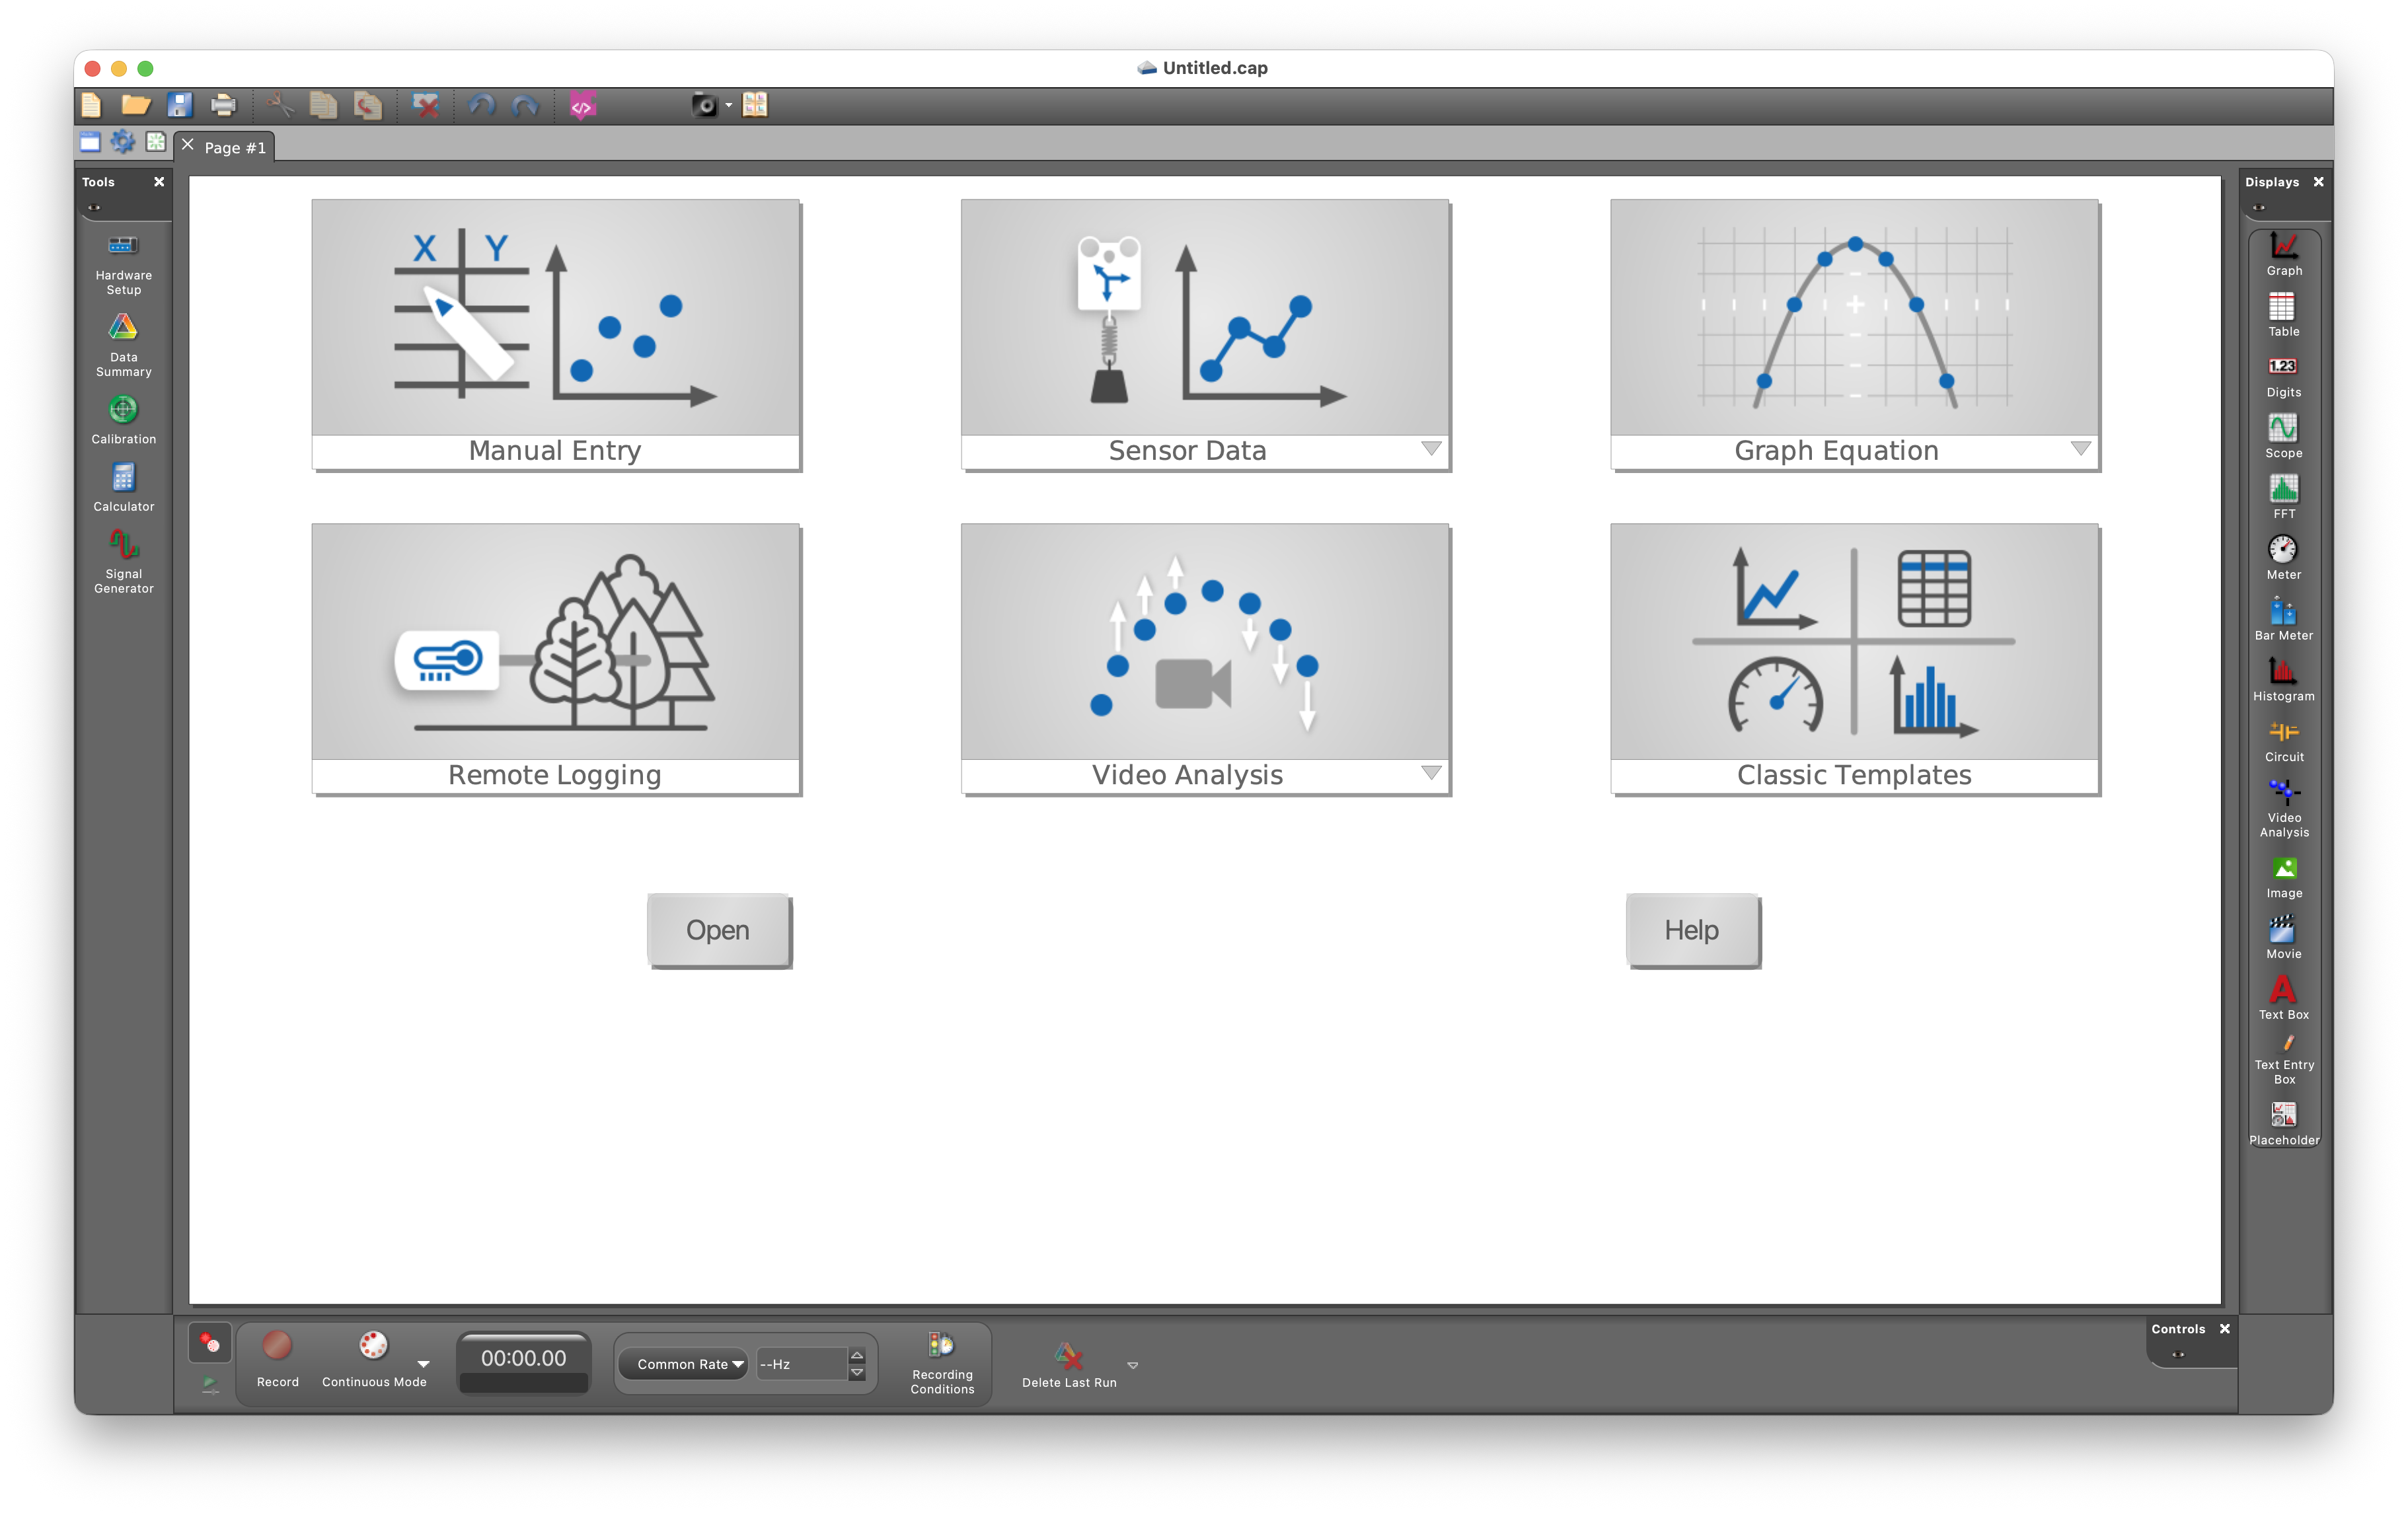
- Open Pasco Capstone. Note the Video Analysis option. Click on the triangle and select open file.
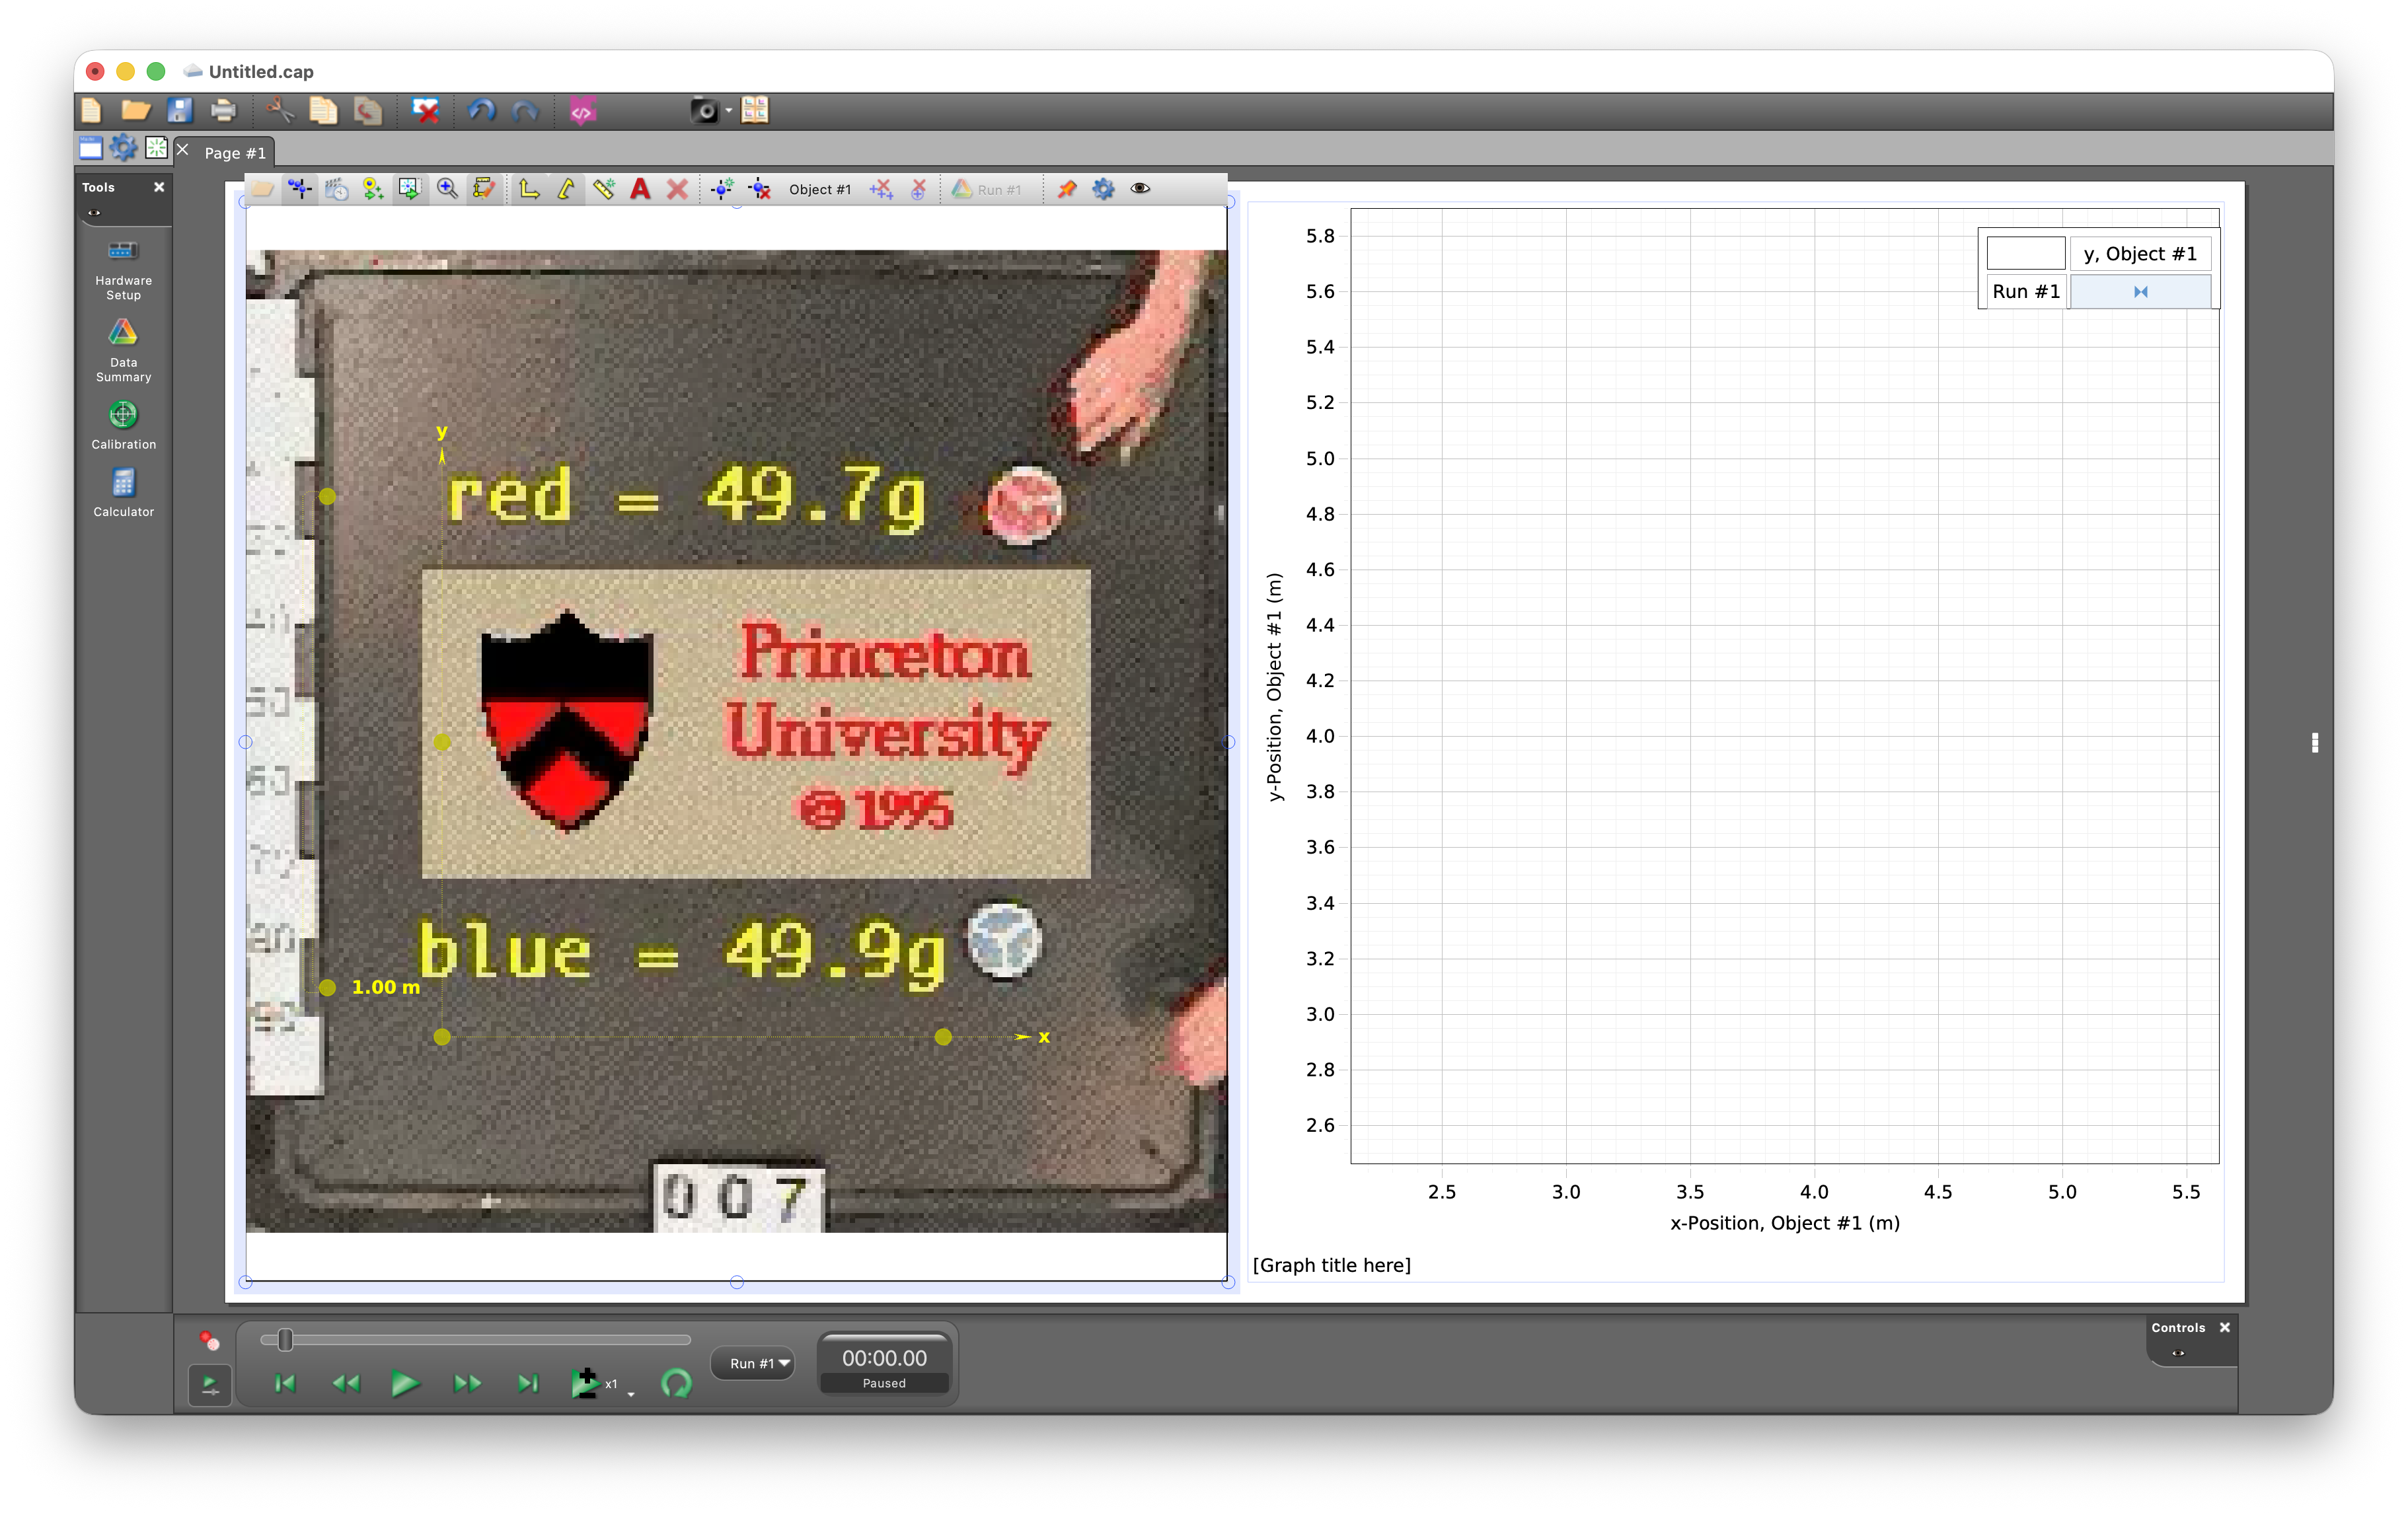
- On the left-hand side of the video you see the calibration tool which by default is set to 1 m. Drag the tool to the refence distance in your video and define its actual length.
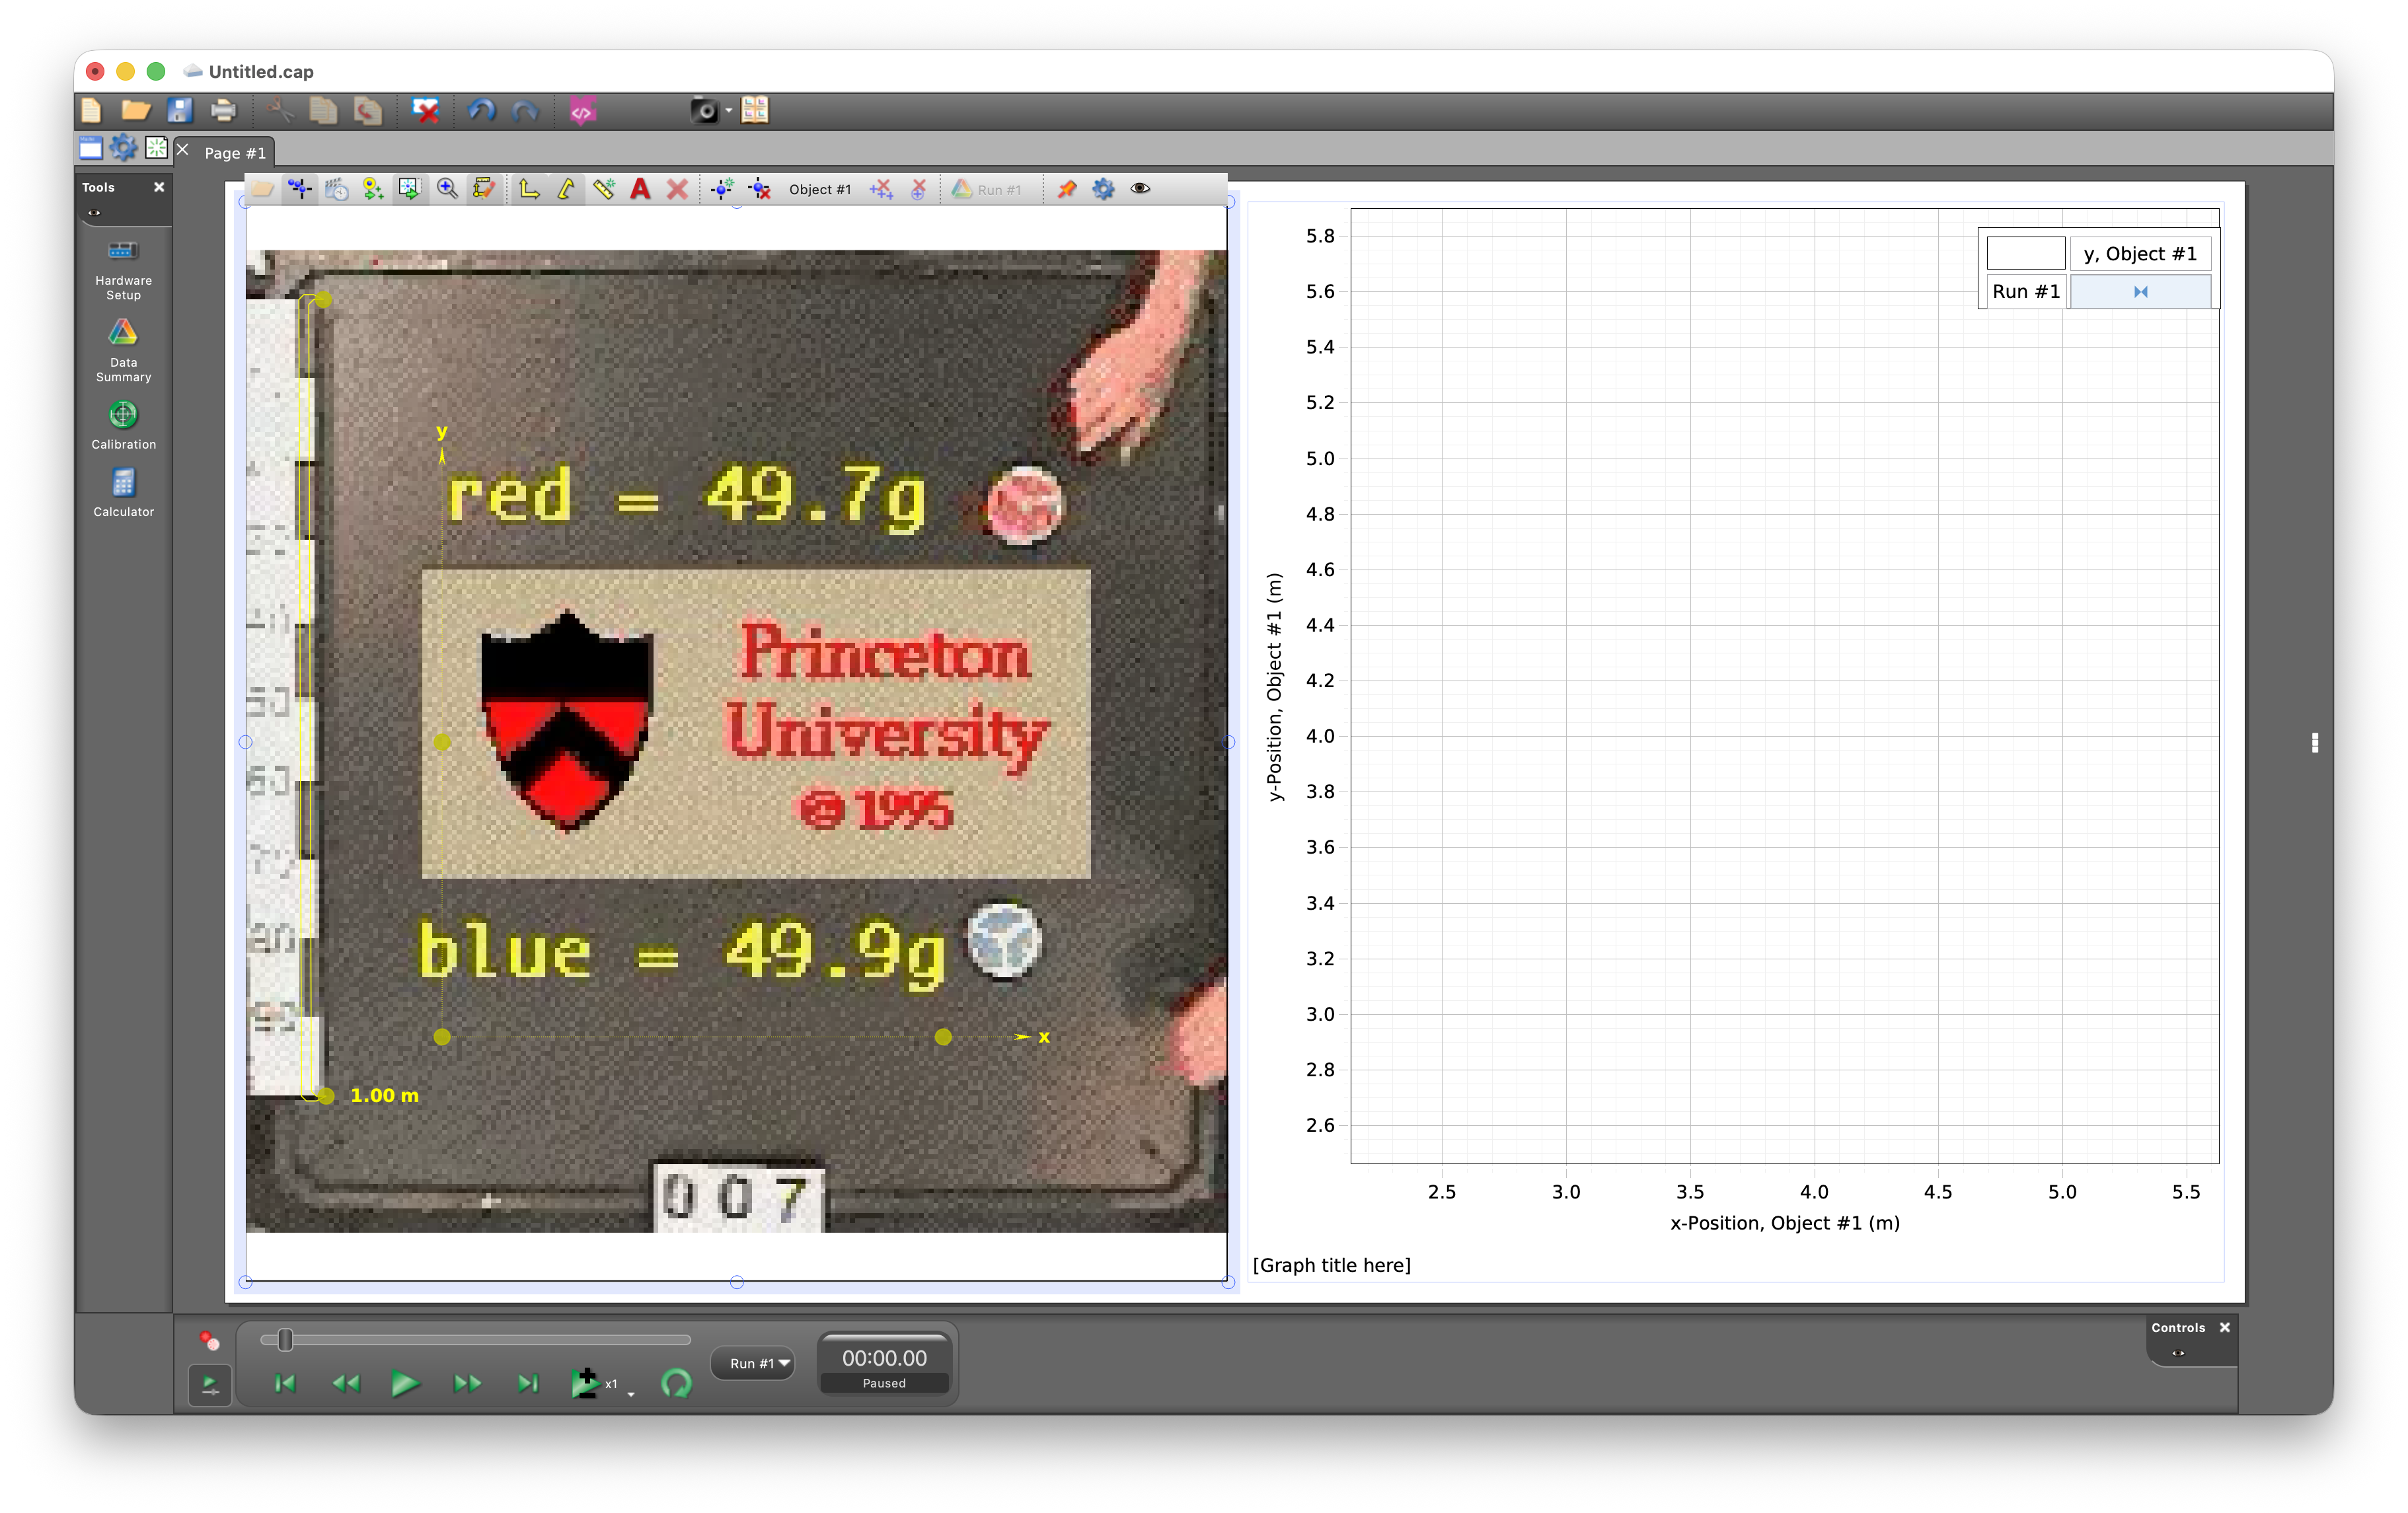
- Calibrate the video by moving the calibration to the top and bottom of the height measurement indicated in the video frame.
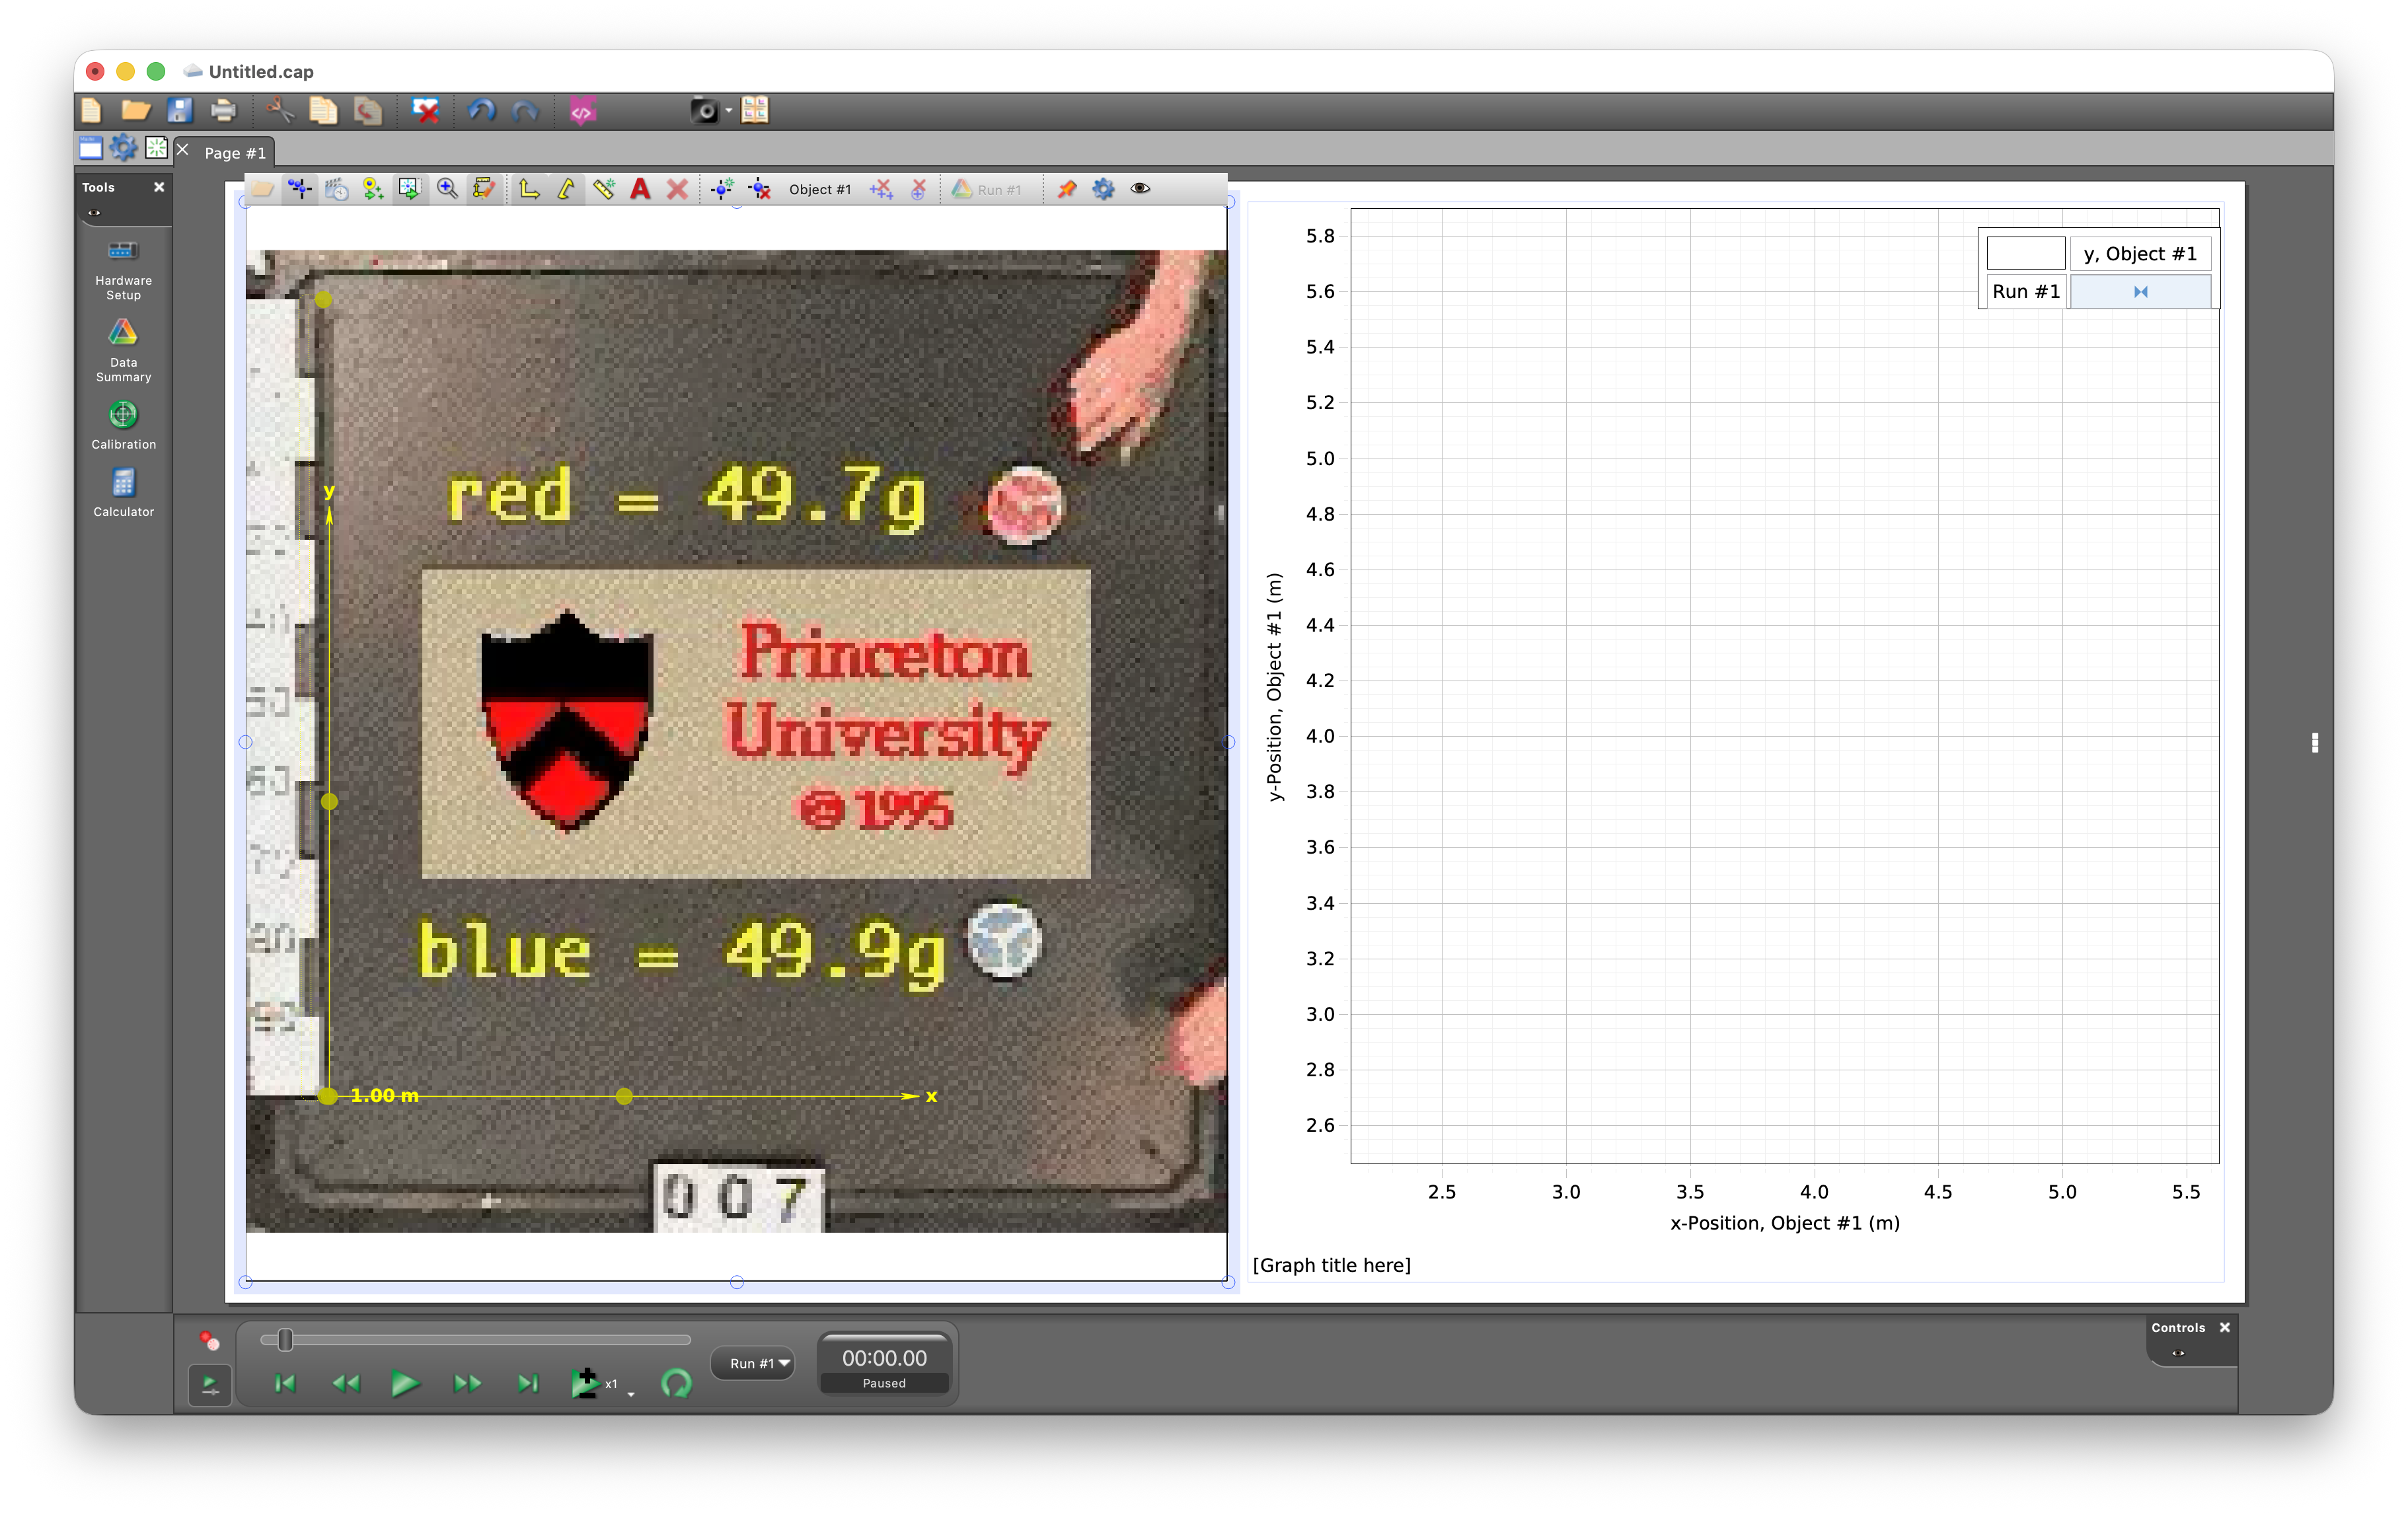
- You can move the origin of the coordinate system to a different position (I moved it to the bottom of the bar that shows the height of the shuttle).
- Since there are two objects you need to track (the red and the blue puck) you need to add a second object. You do this by clicking on the "Create Tracked Object" button. The second object will be called Object # 2.
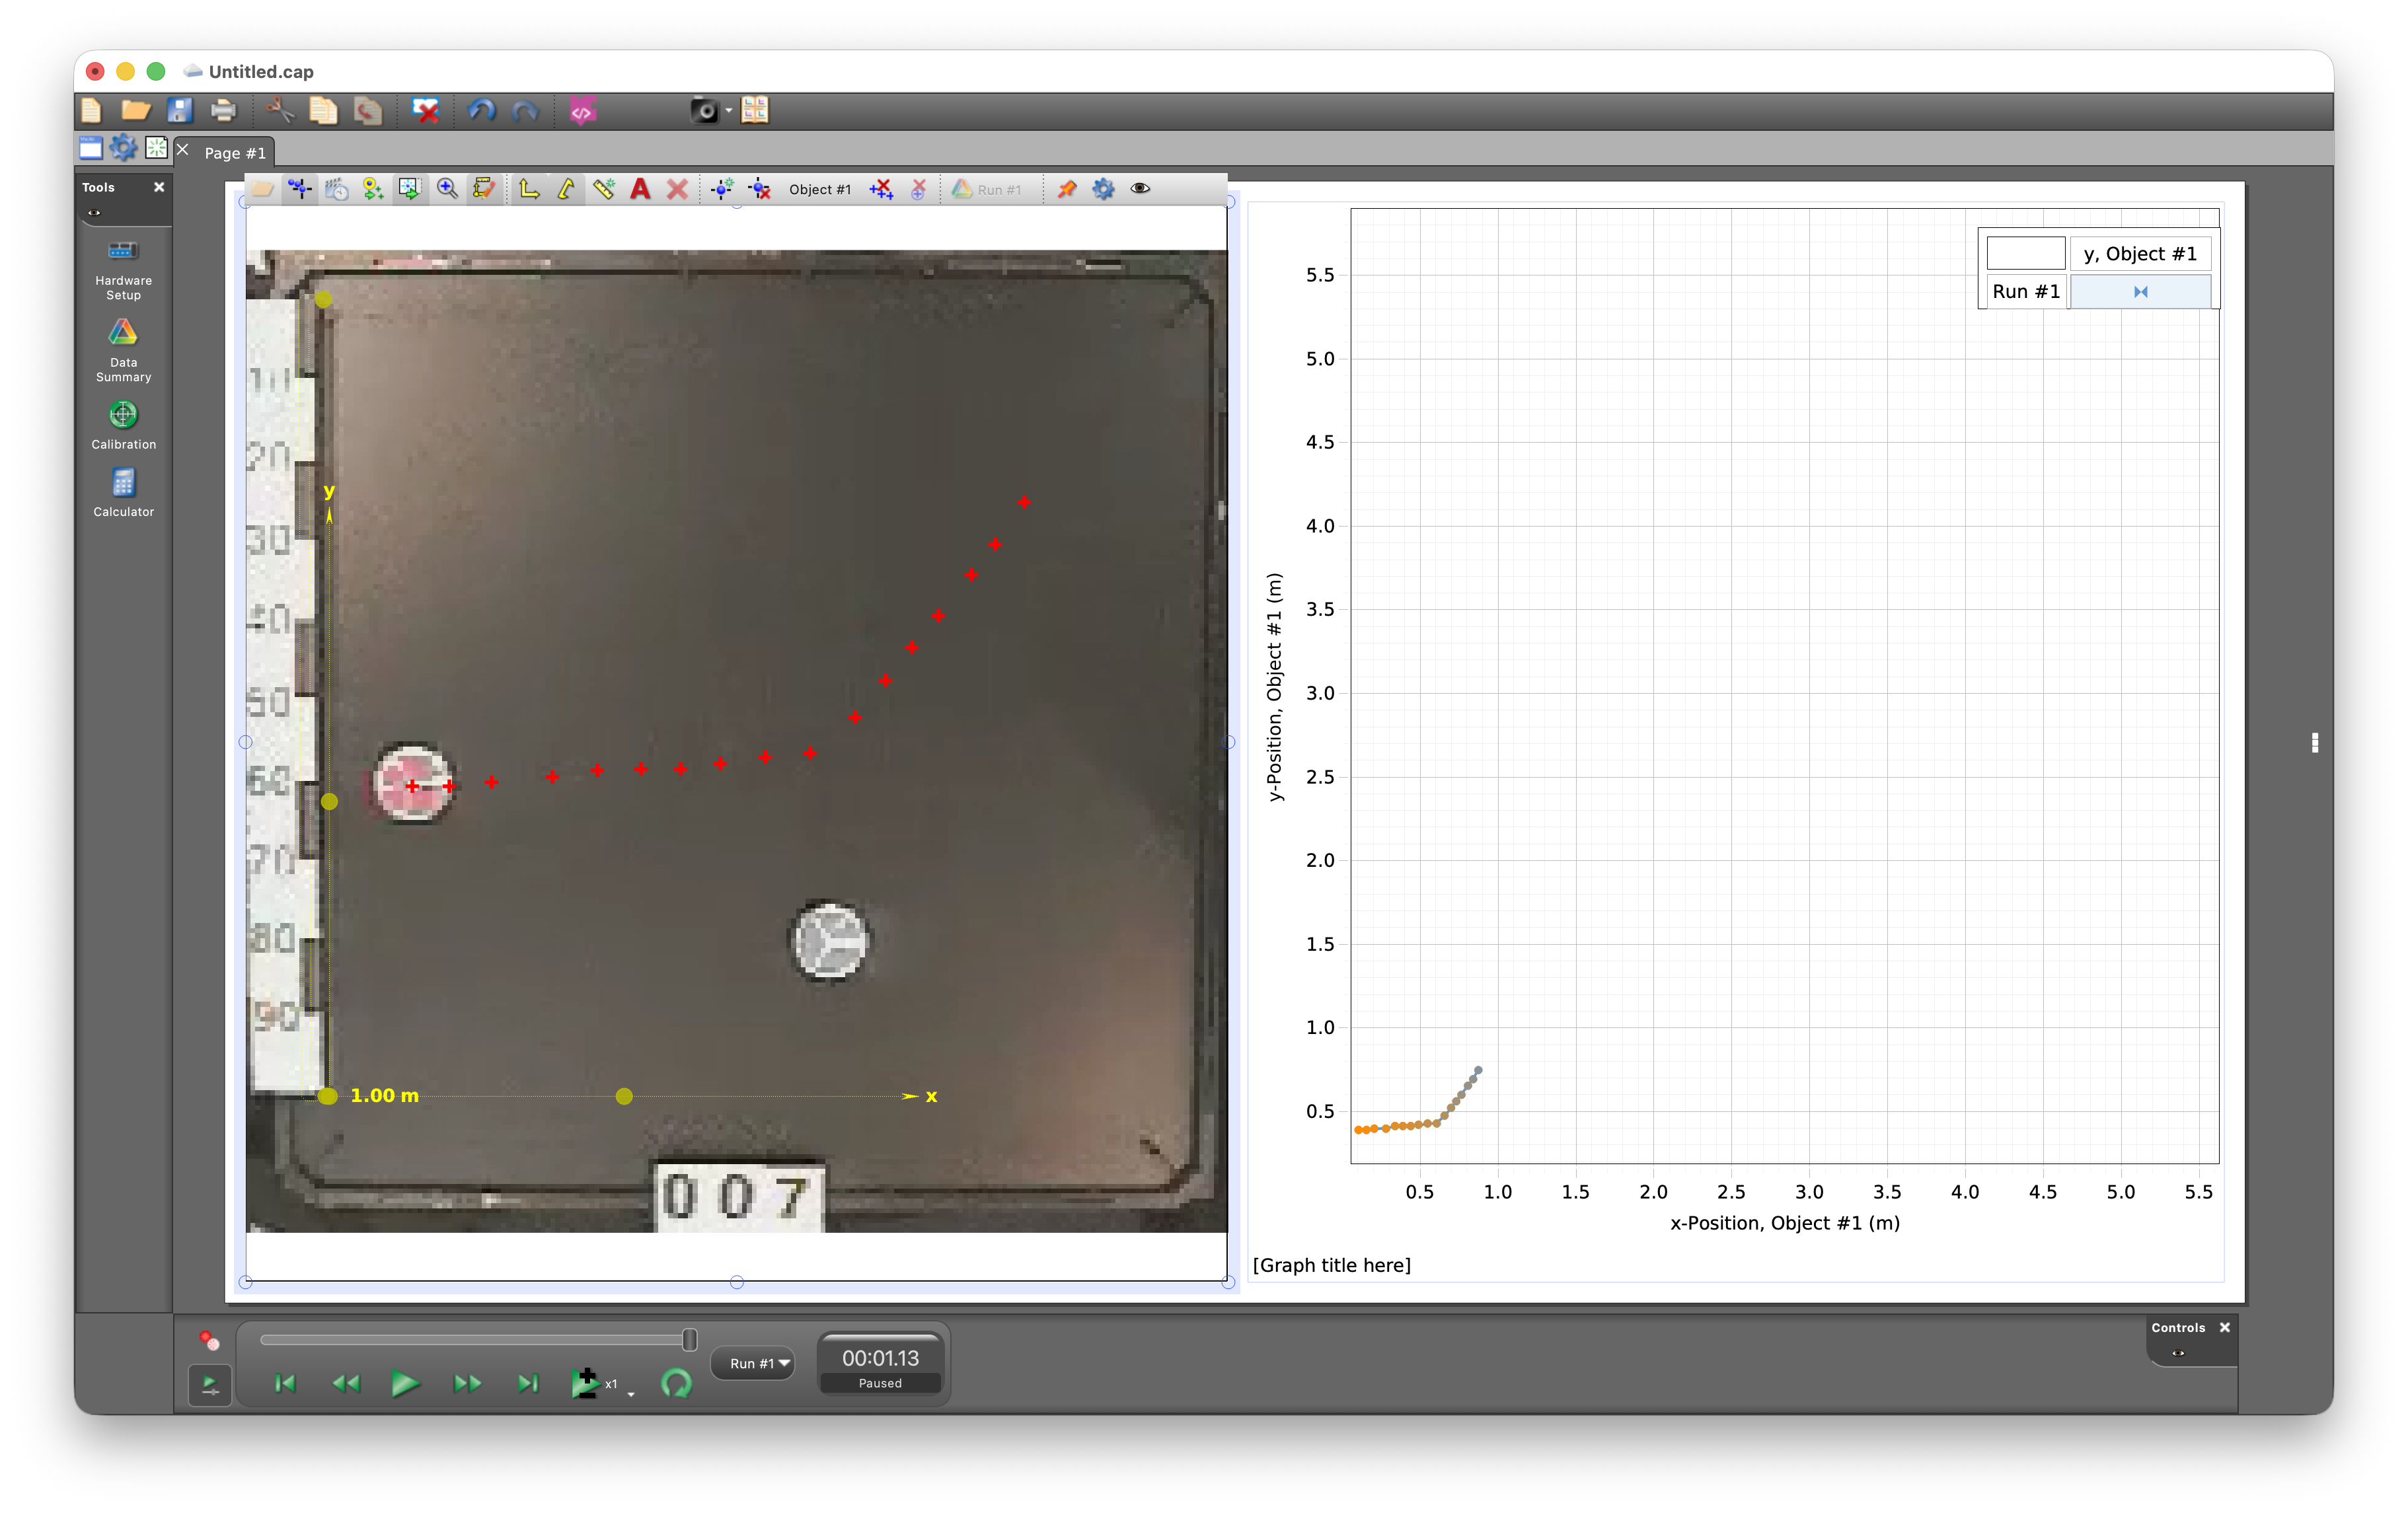
- You are now ready to start tracking the motion. You will track each object independently. Select object # 1 (you will see Object # 1 listed in the menu bar abive the video) and click on the center of the red puck. A red cross will appear and the video will advance by one frame. Repeat this process until you have reached the end of the video. As you click, the data points are show on the graph on the right-hand side.
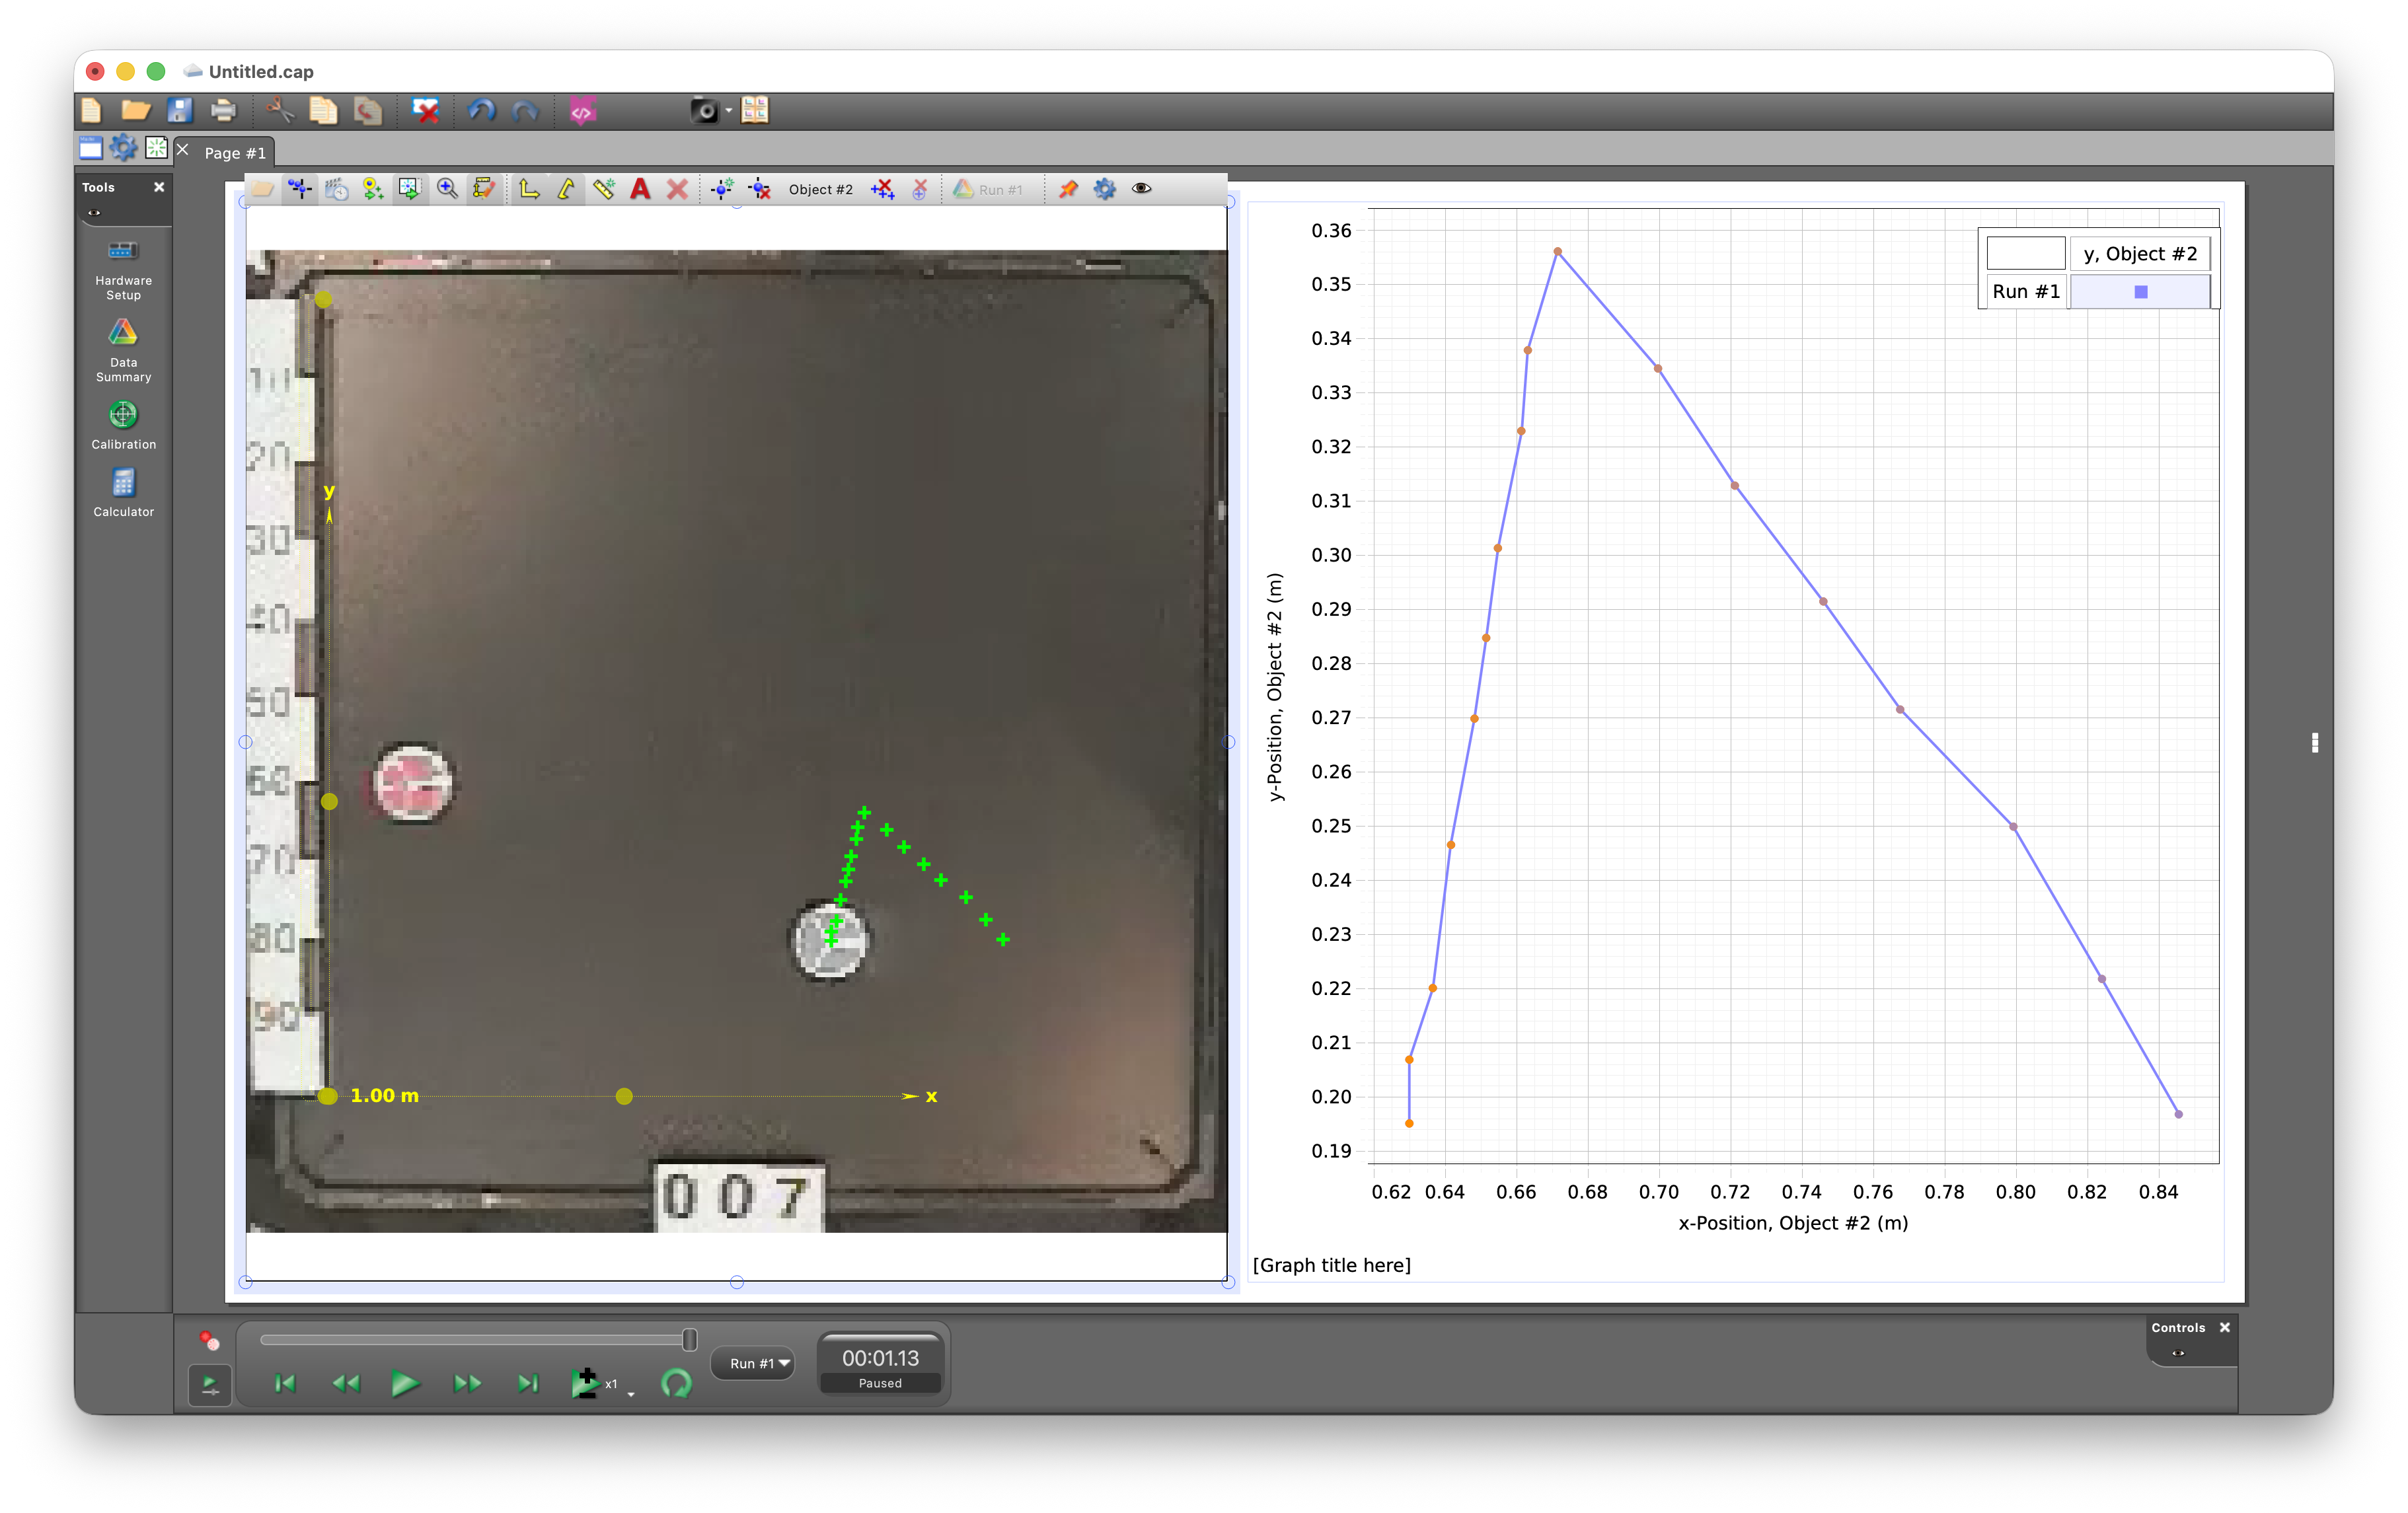
- Rewind the video and select object # 2. You can then click on the center of the blue puck. A sgree cross will appear and the video will advance by one frame. Repeat this process until you have reached the end of the video. If you want to see the new data points in the graph on the right, you need to change what is shown from Object # 1 to Object # 2 by clicking on the lables of the x and y axes
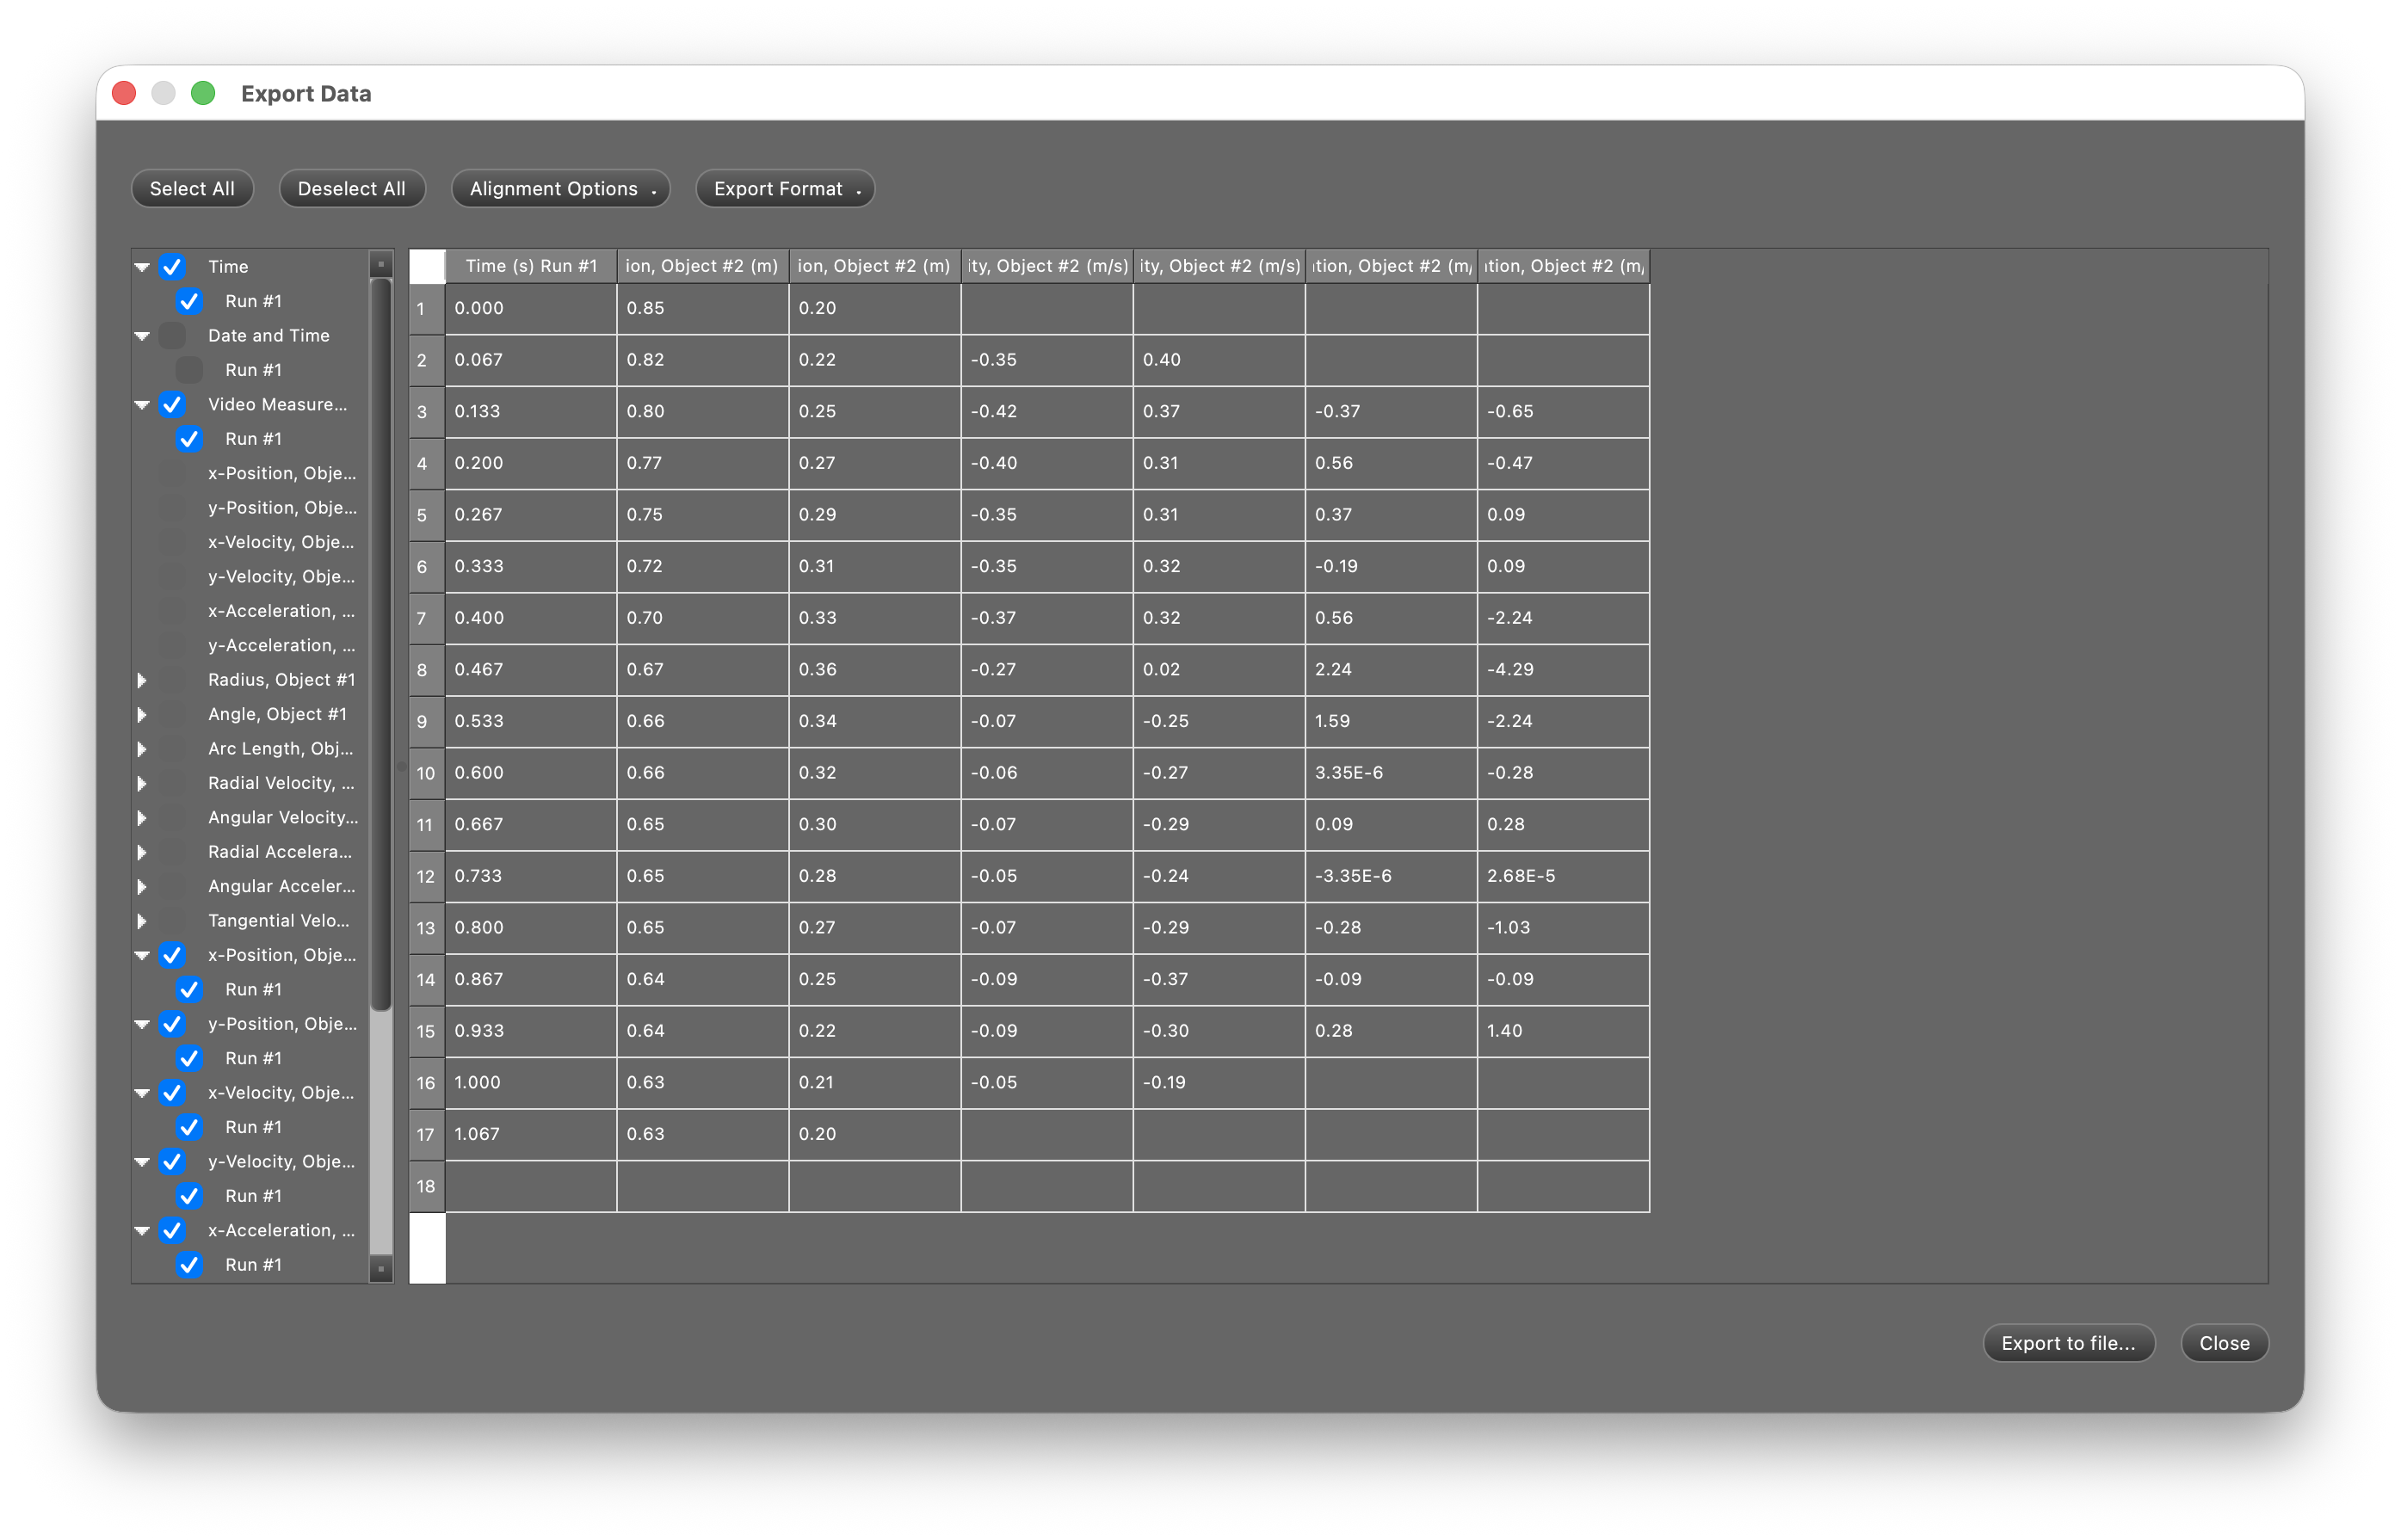
- To export the data points contained in the graph, you go to the file menu and select export data. The following window will open.
- By changing the axes on the graph you can obtain the data for the other puck..
Details on the software can be found on the Pasco website. The following links are relevant:
Last updated on
Monday, October 12, 2026 11:03