This document describes how to use Pasco Capstone for video analysis.
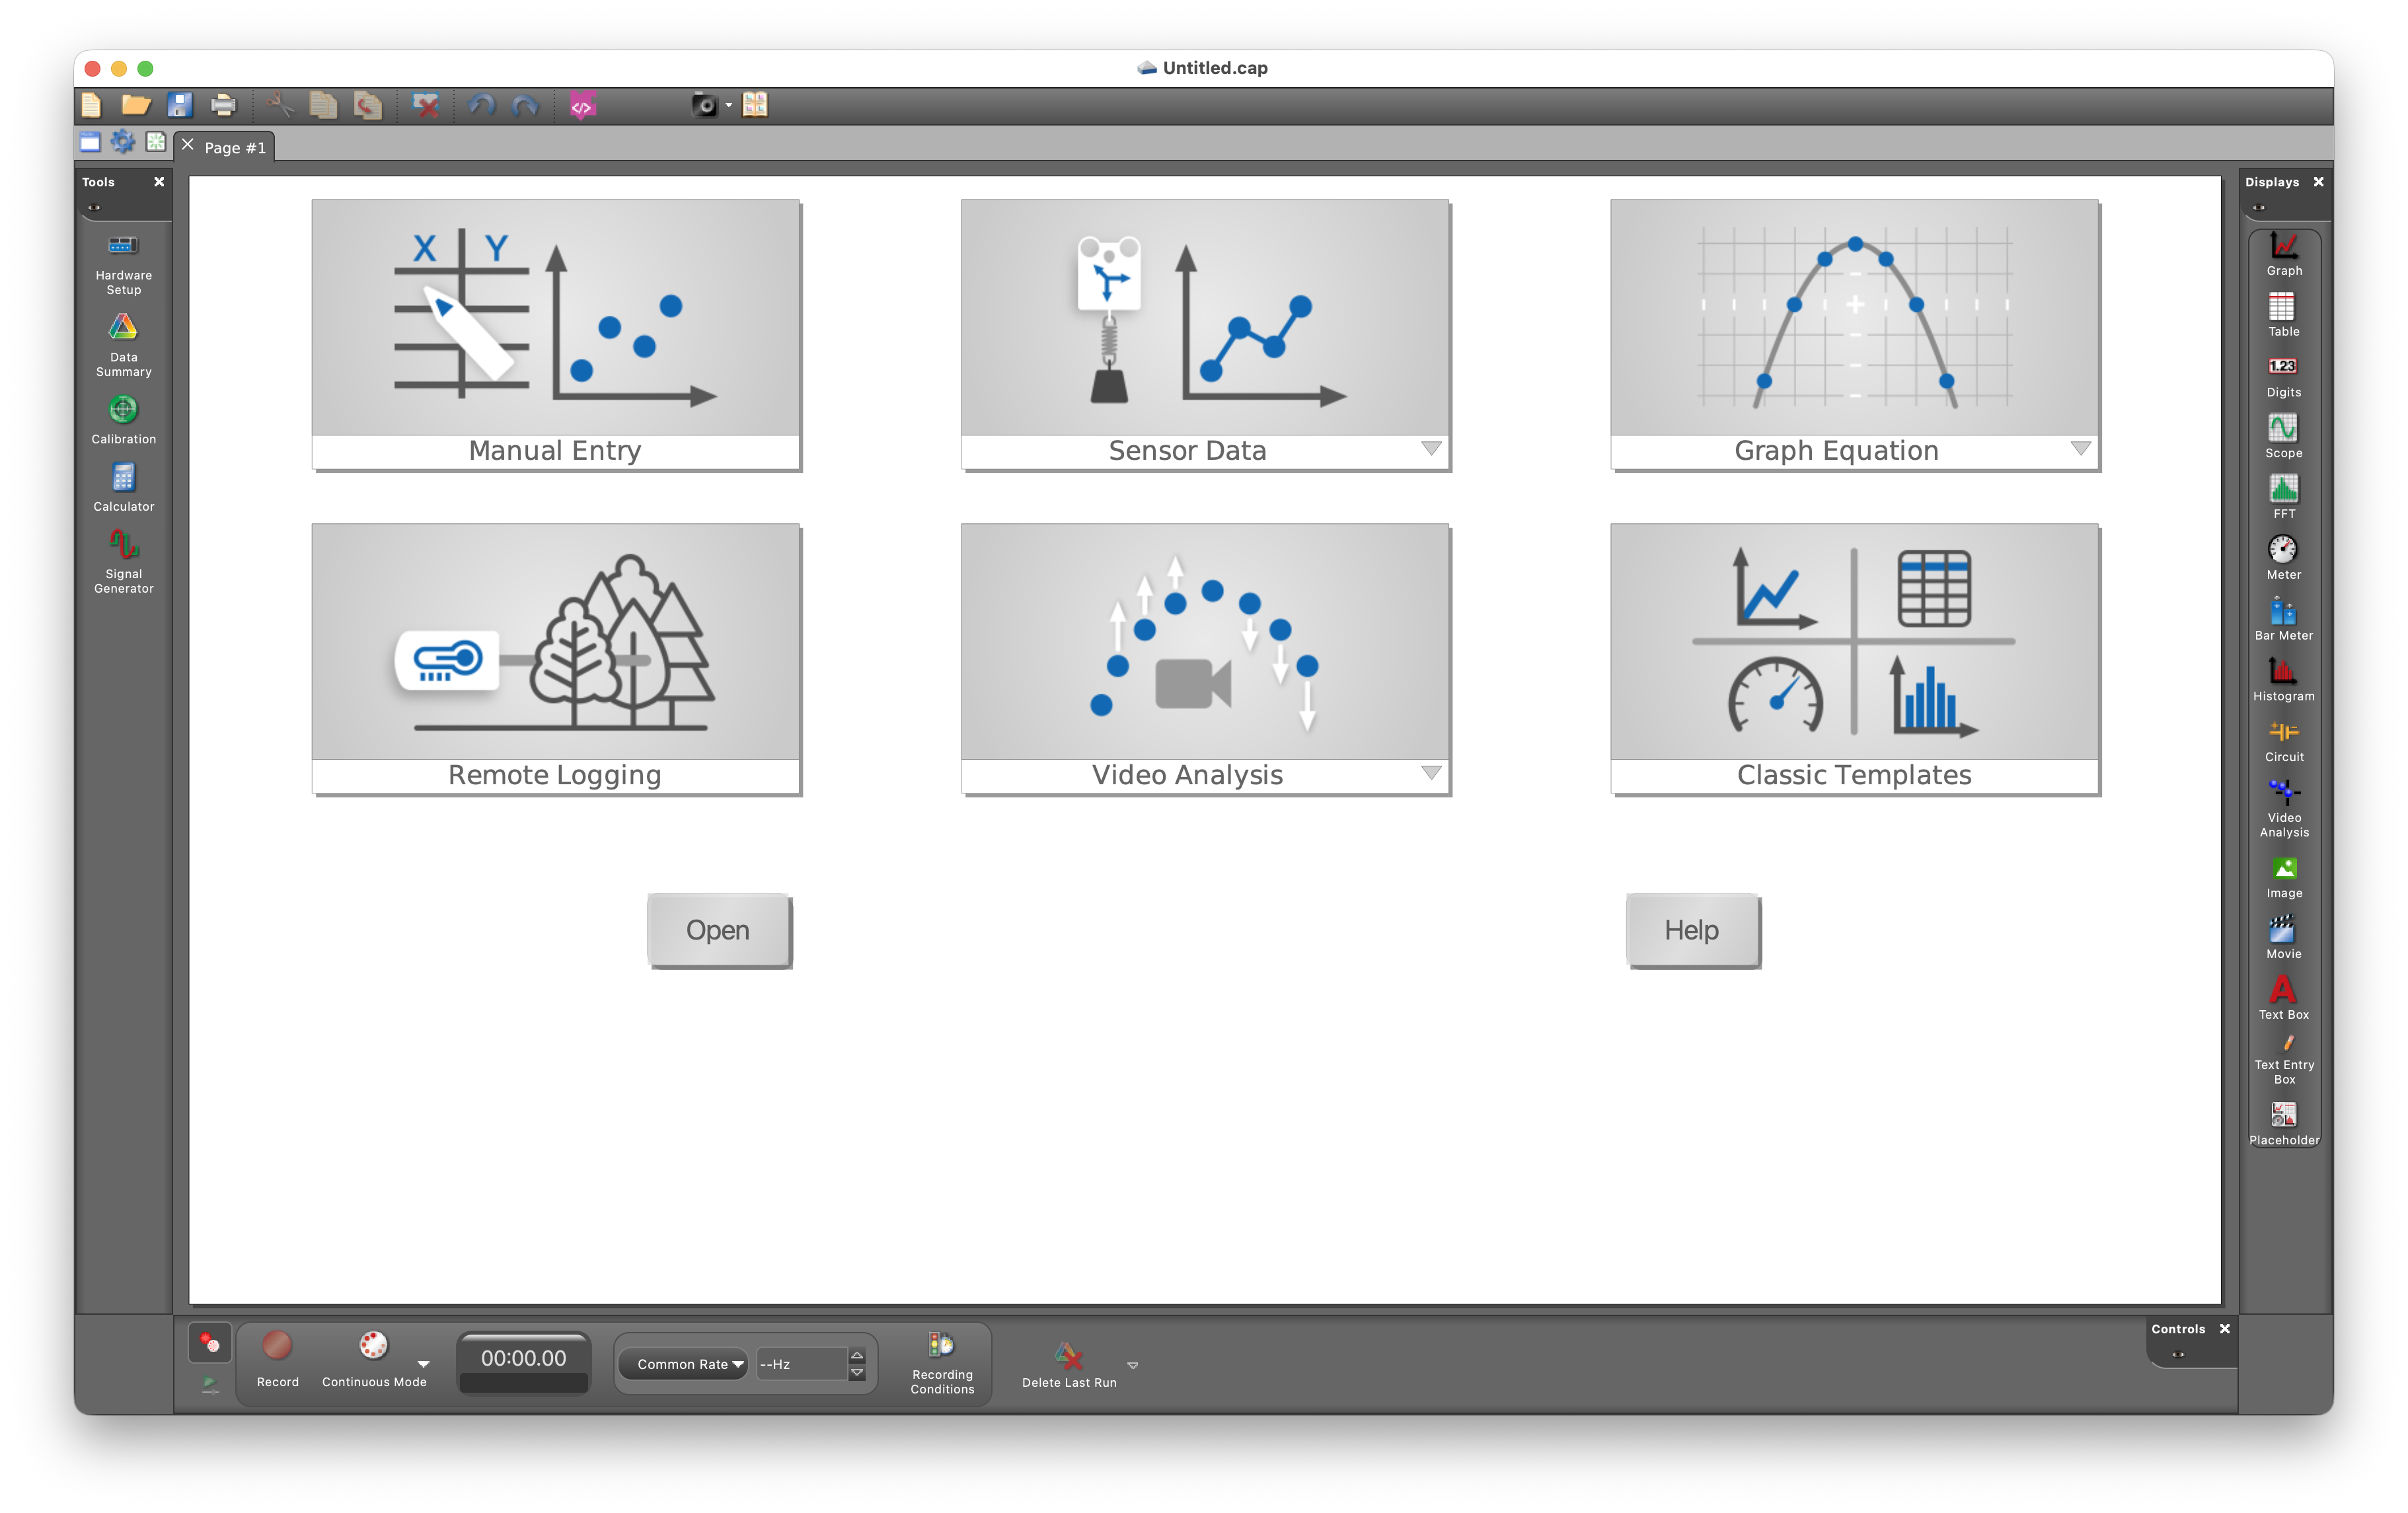
- Open Pasco Capstone. Note the Video Analysis option. Click on the triangle and select open file.
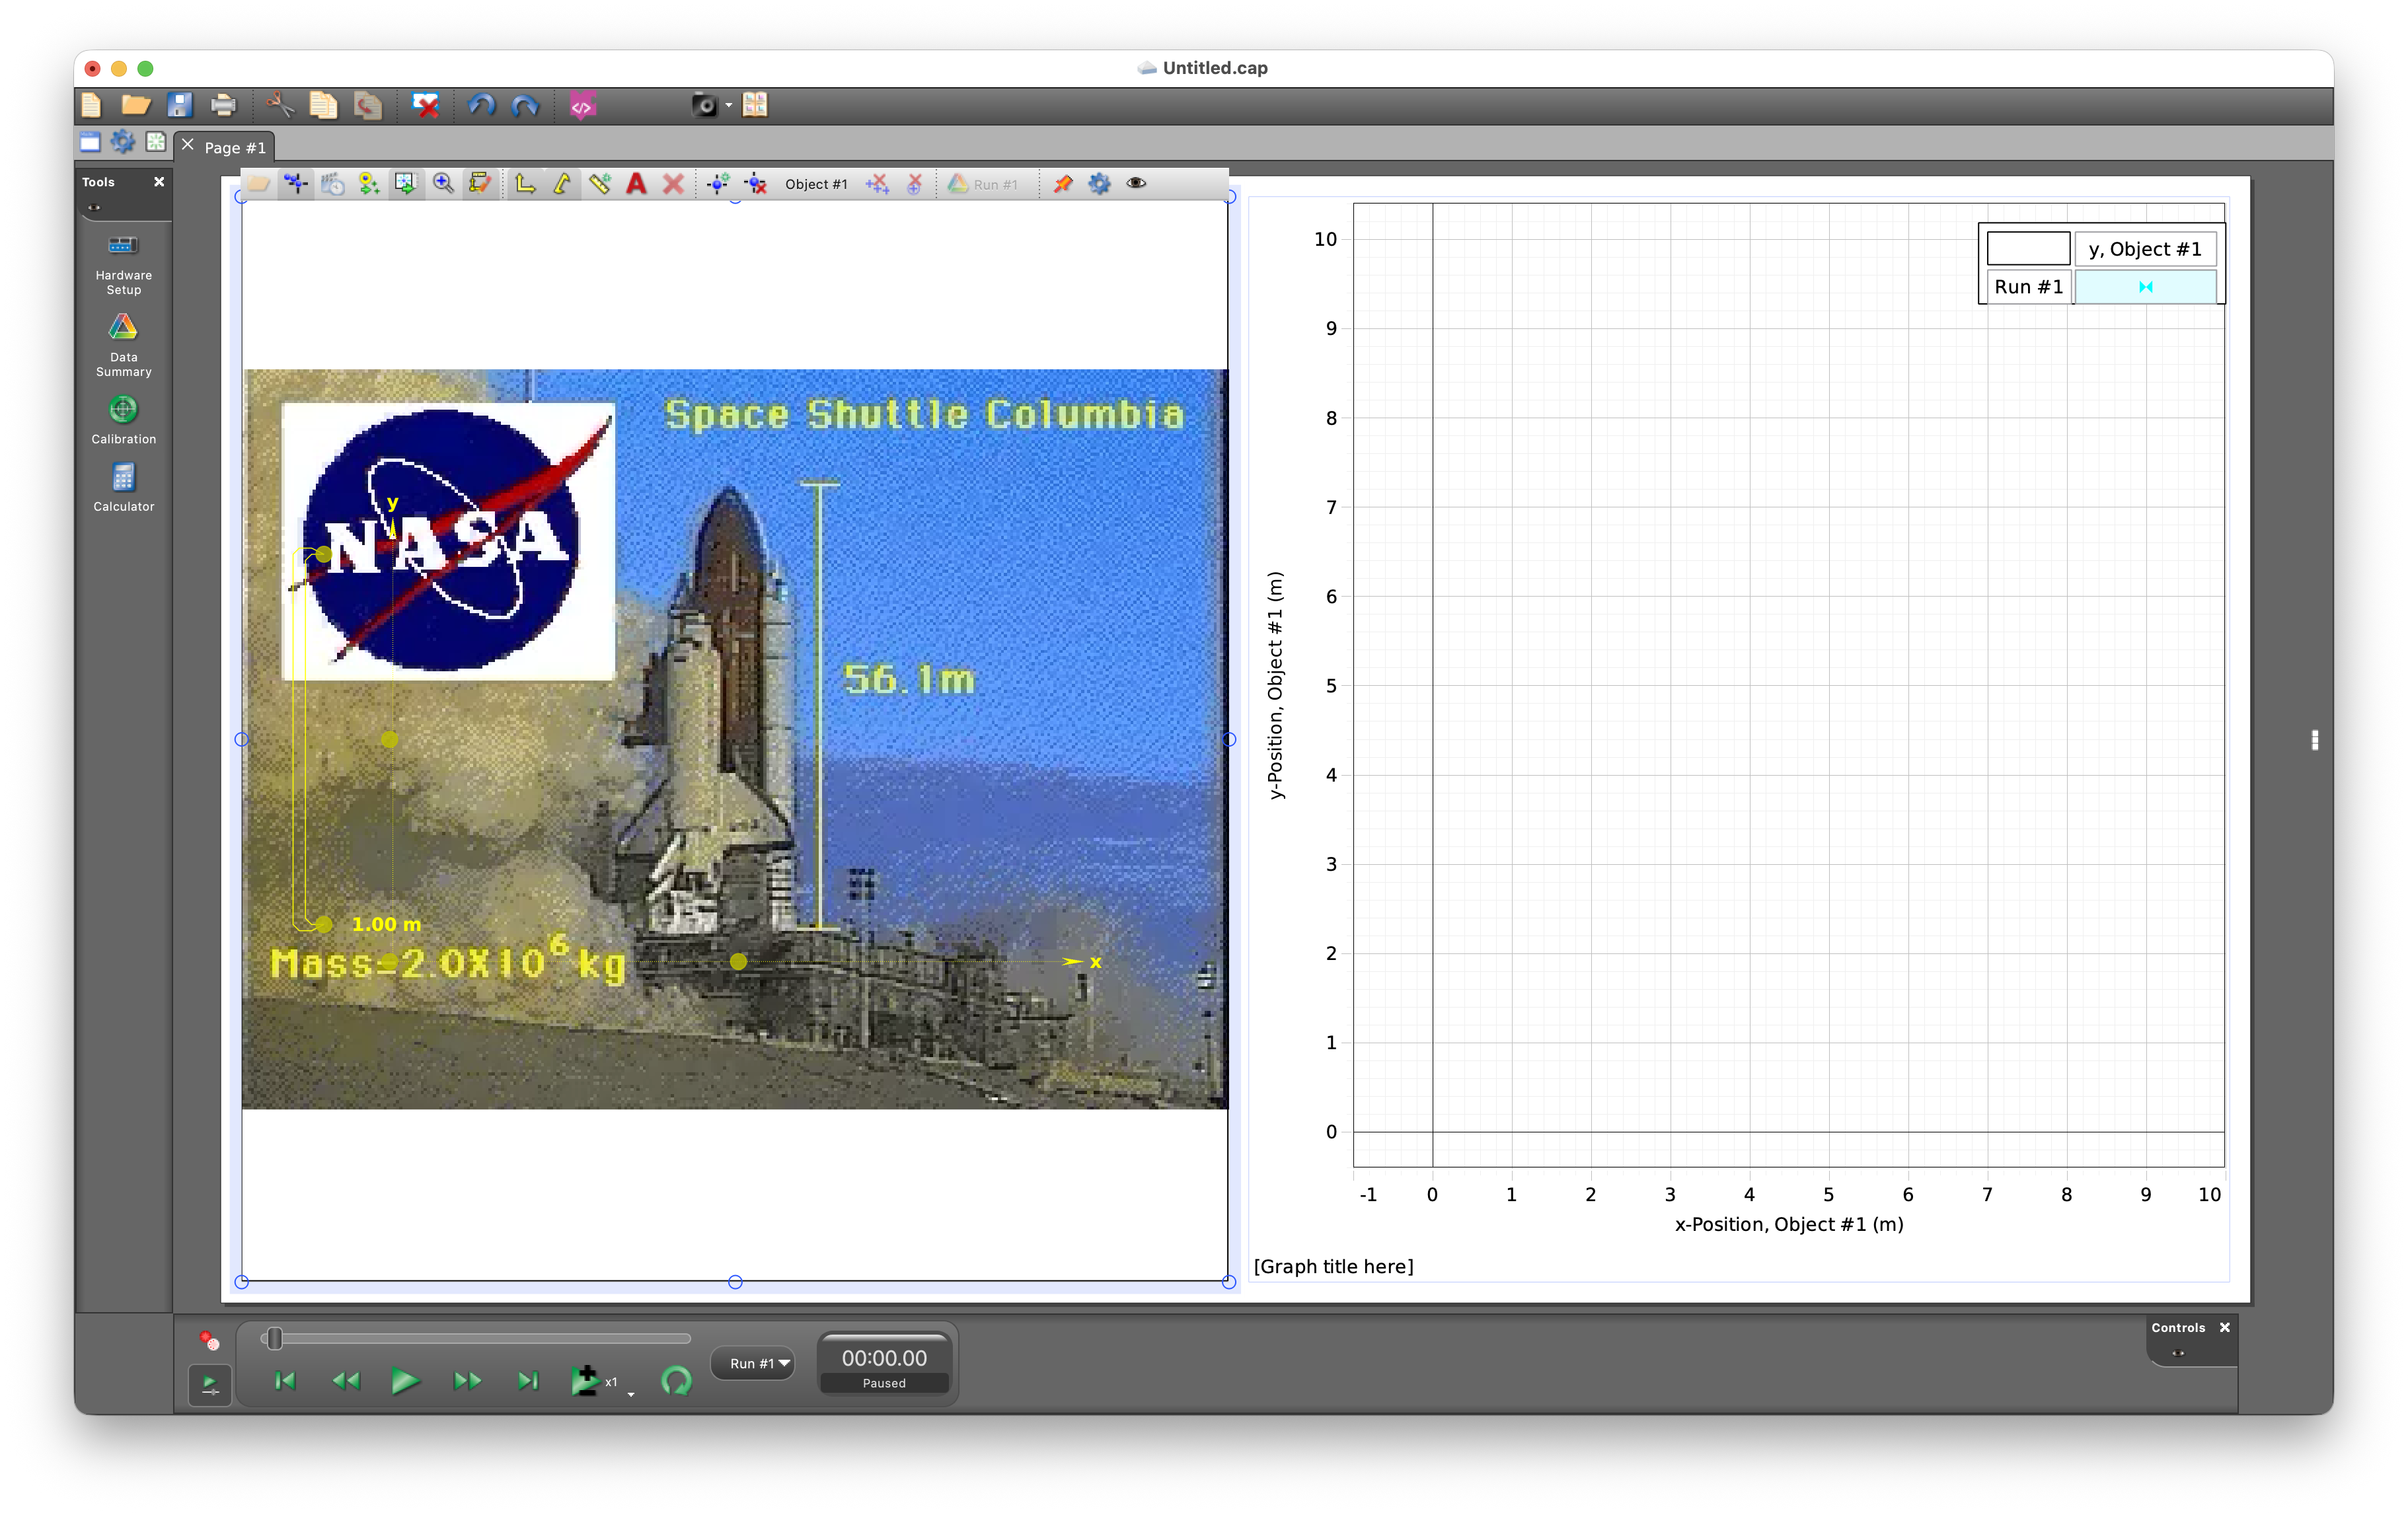
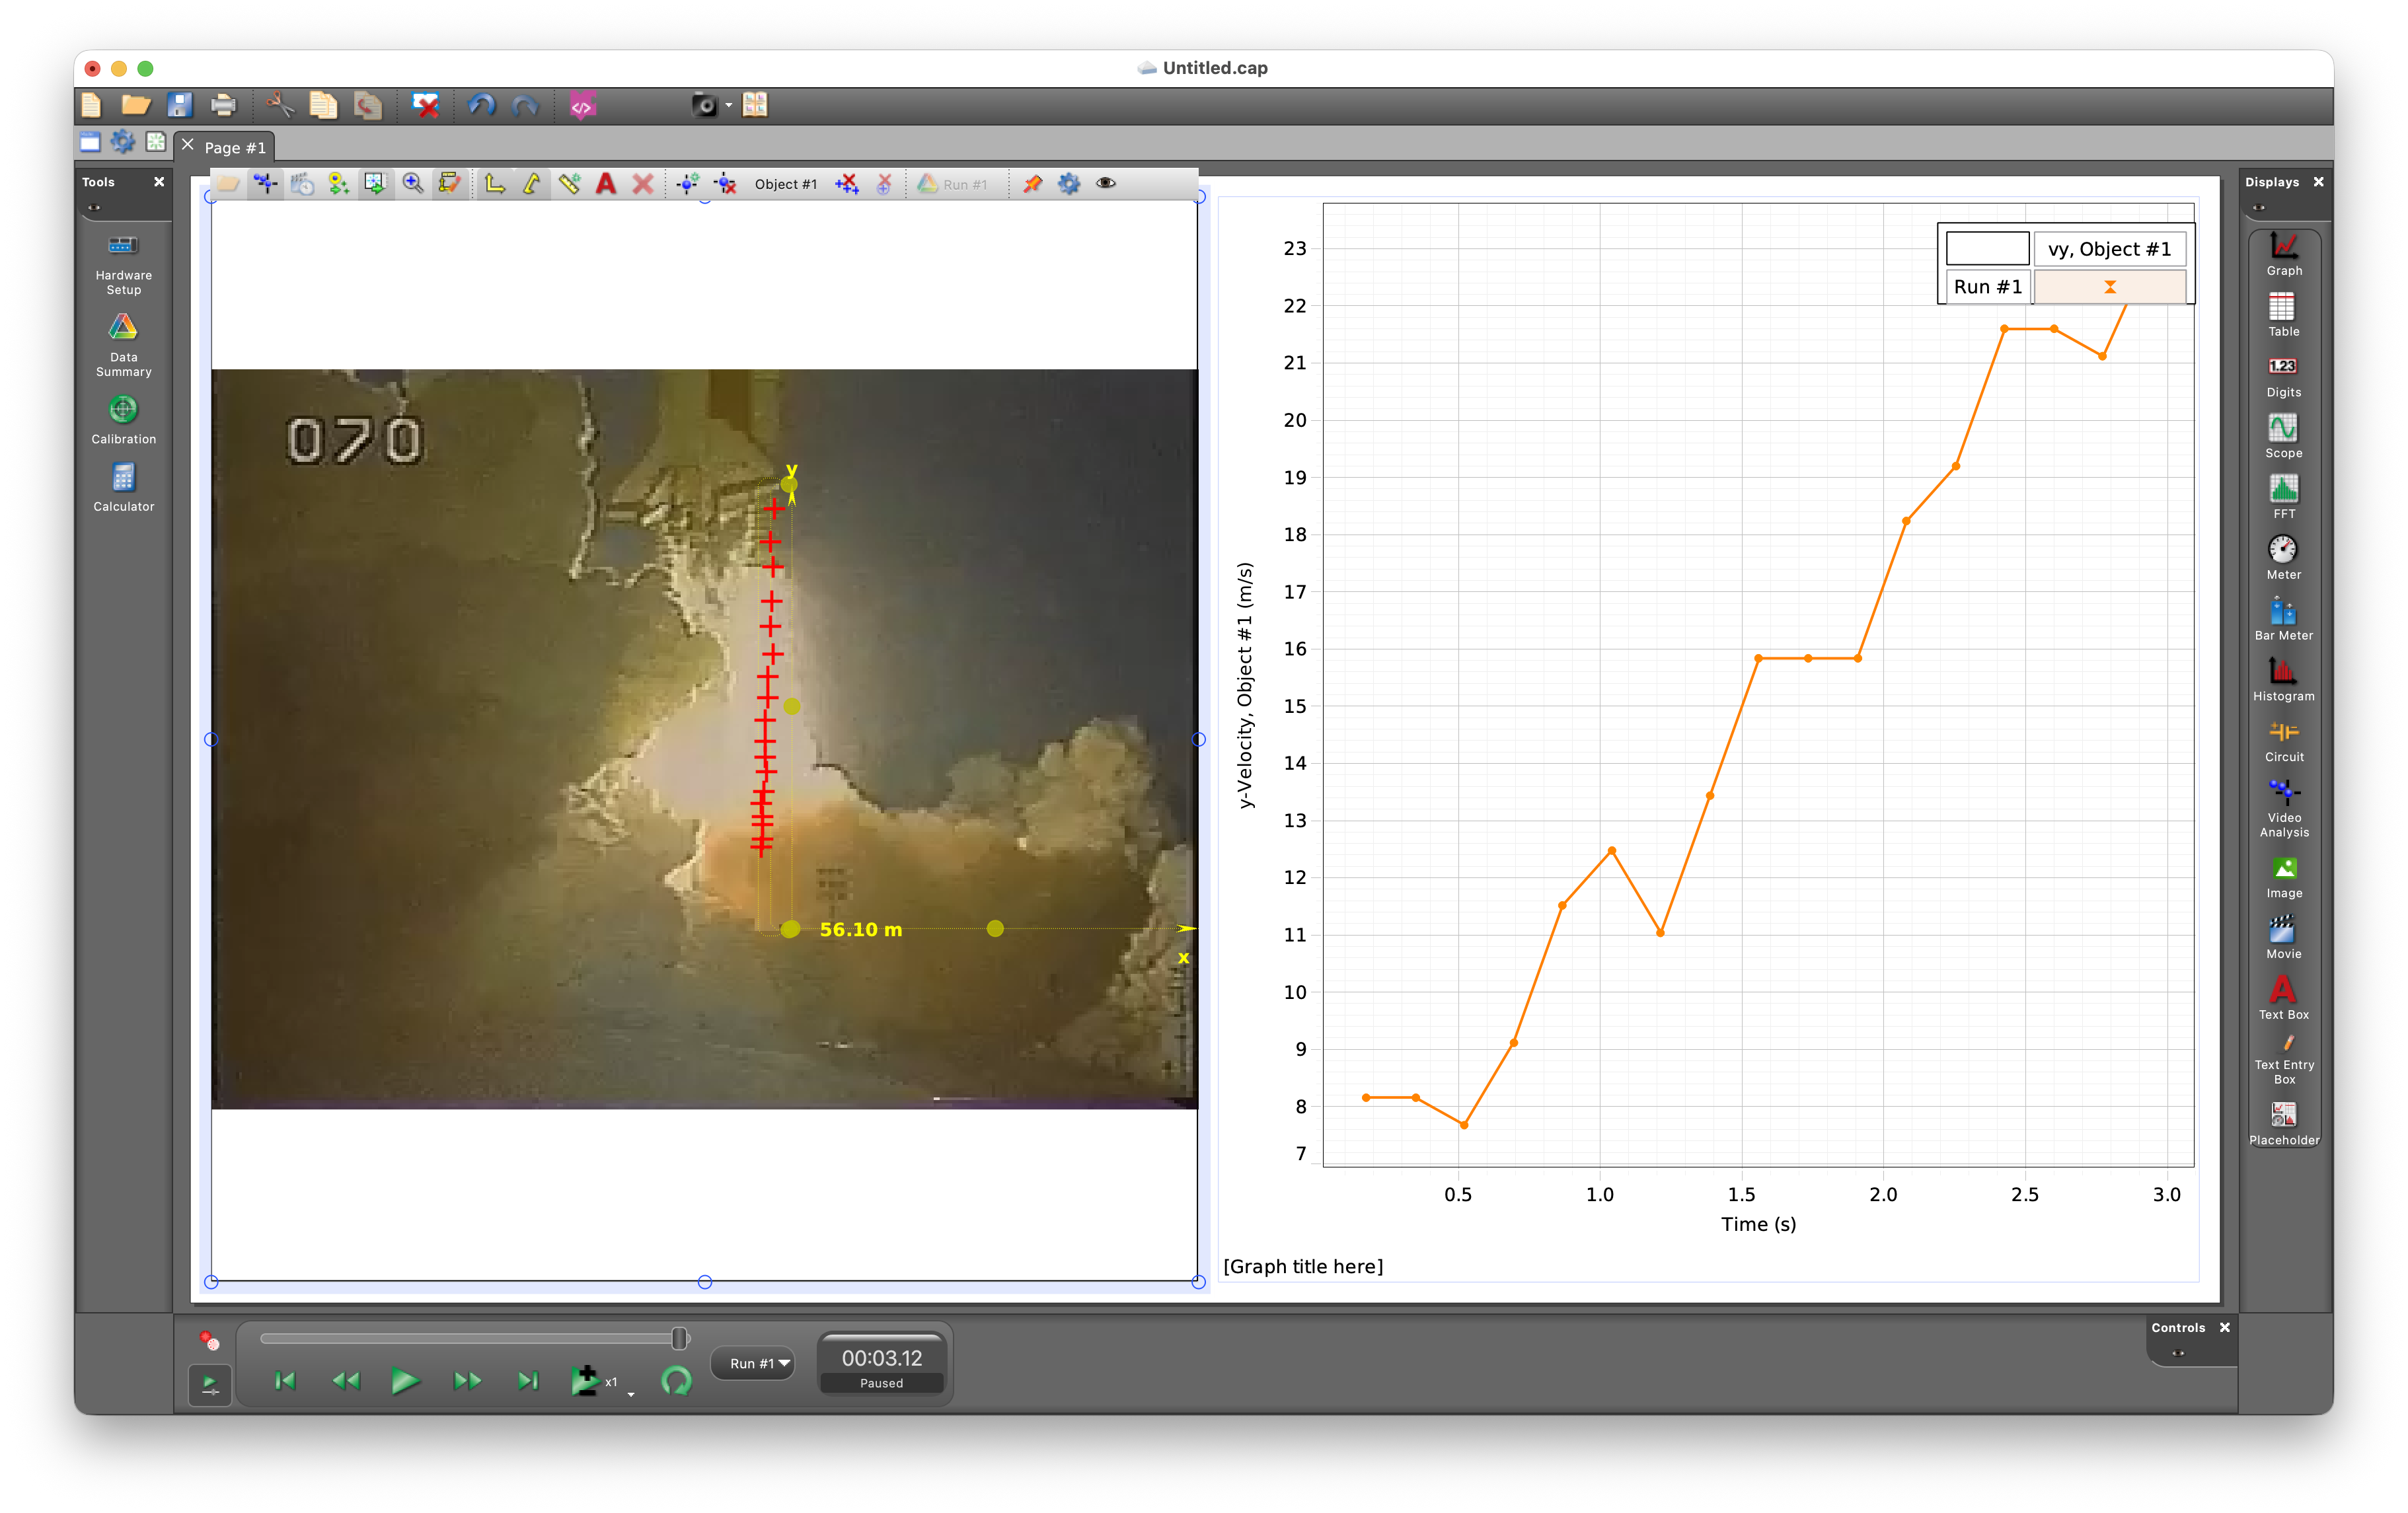
- On the left-hand side of the video you see the calibration tool which by default is set to 1 m. Drag the tool to the refence distance in your video and define its actual length.
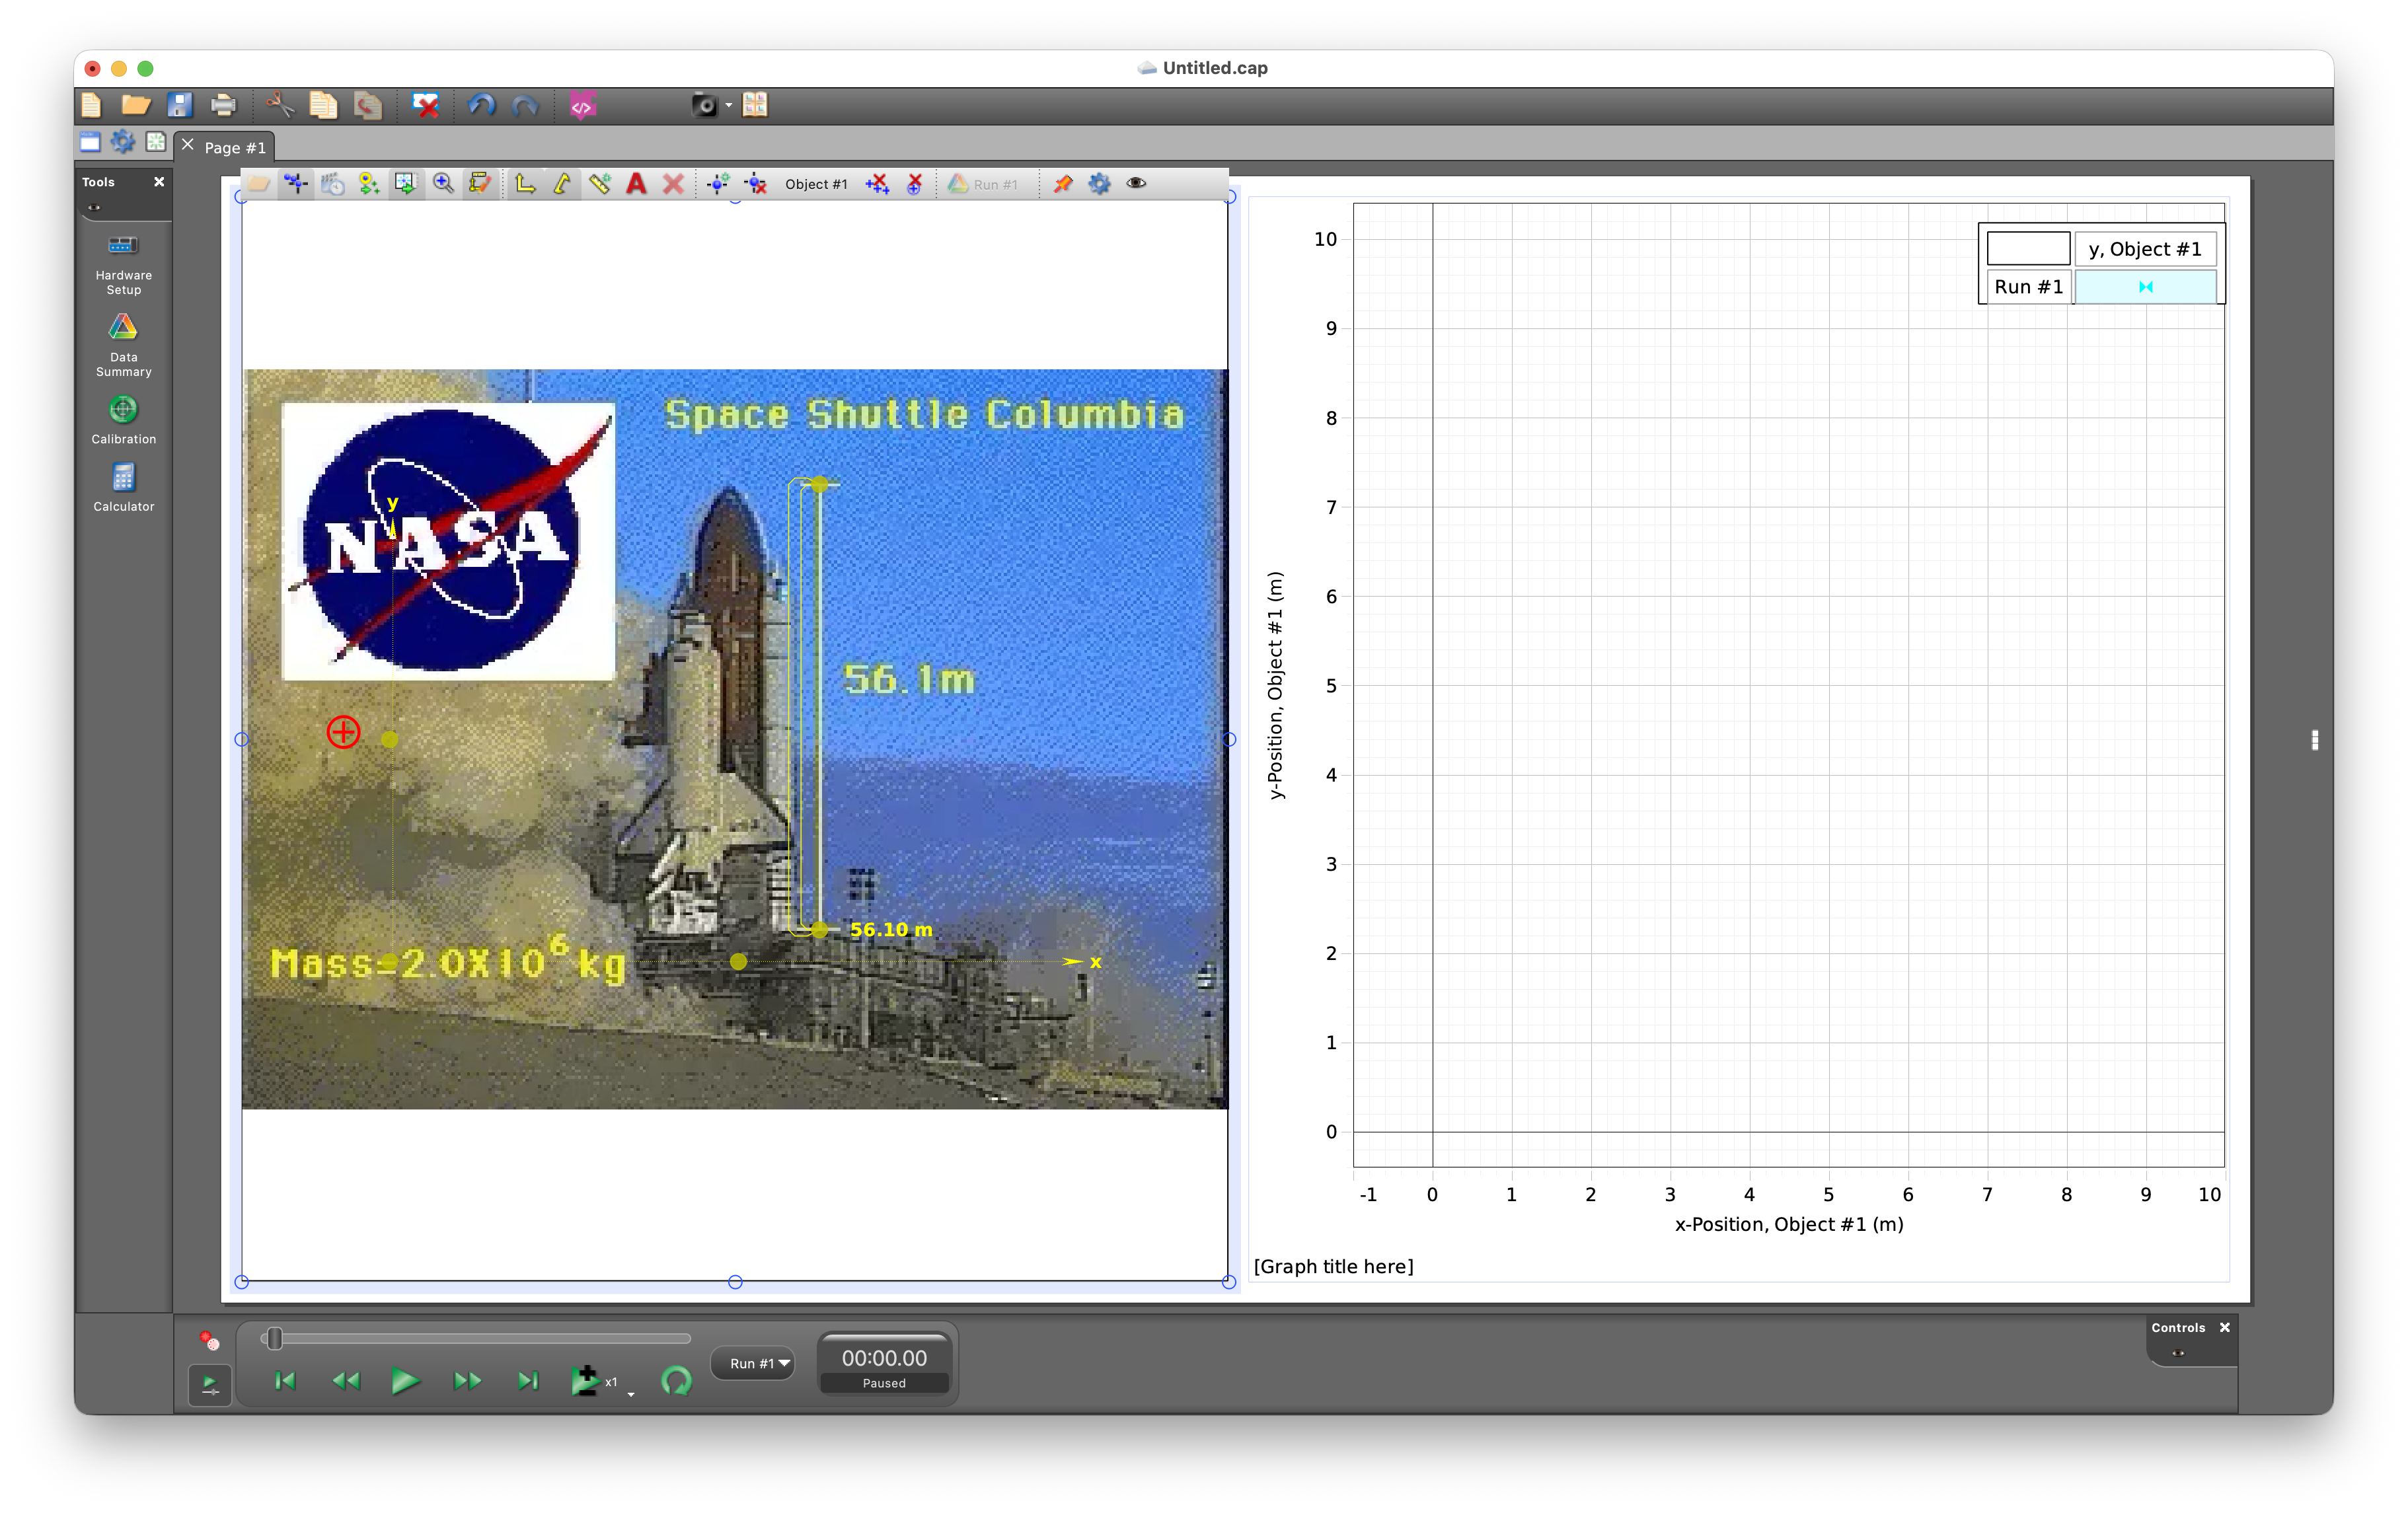
- Calibrate the video by moving the calibration to the top and bottom of the height measurement indicated in the video frame.
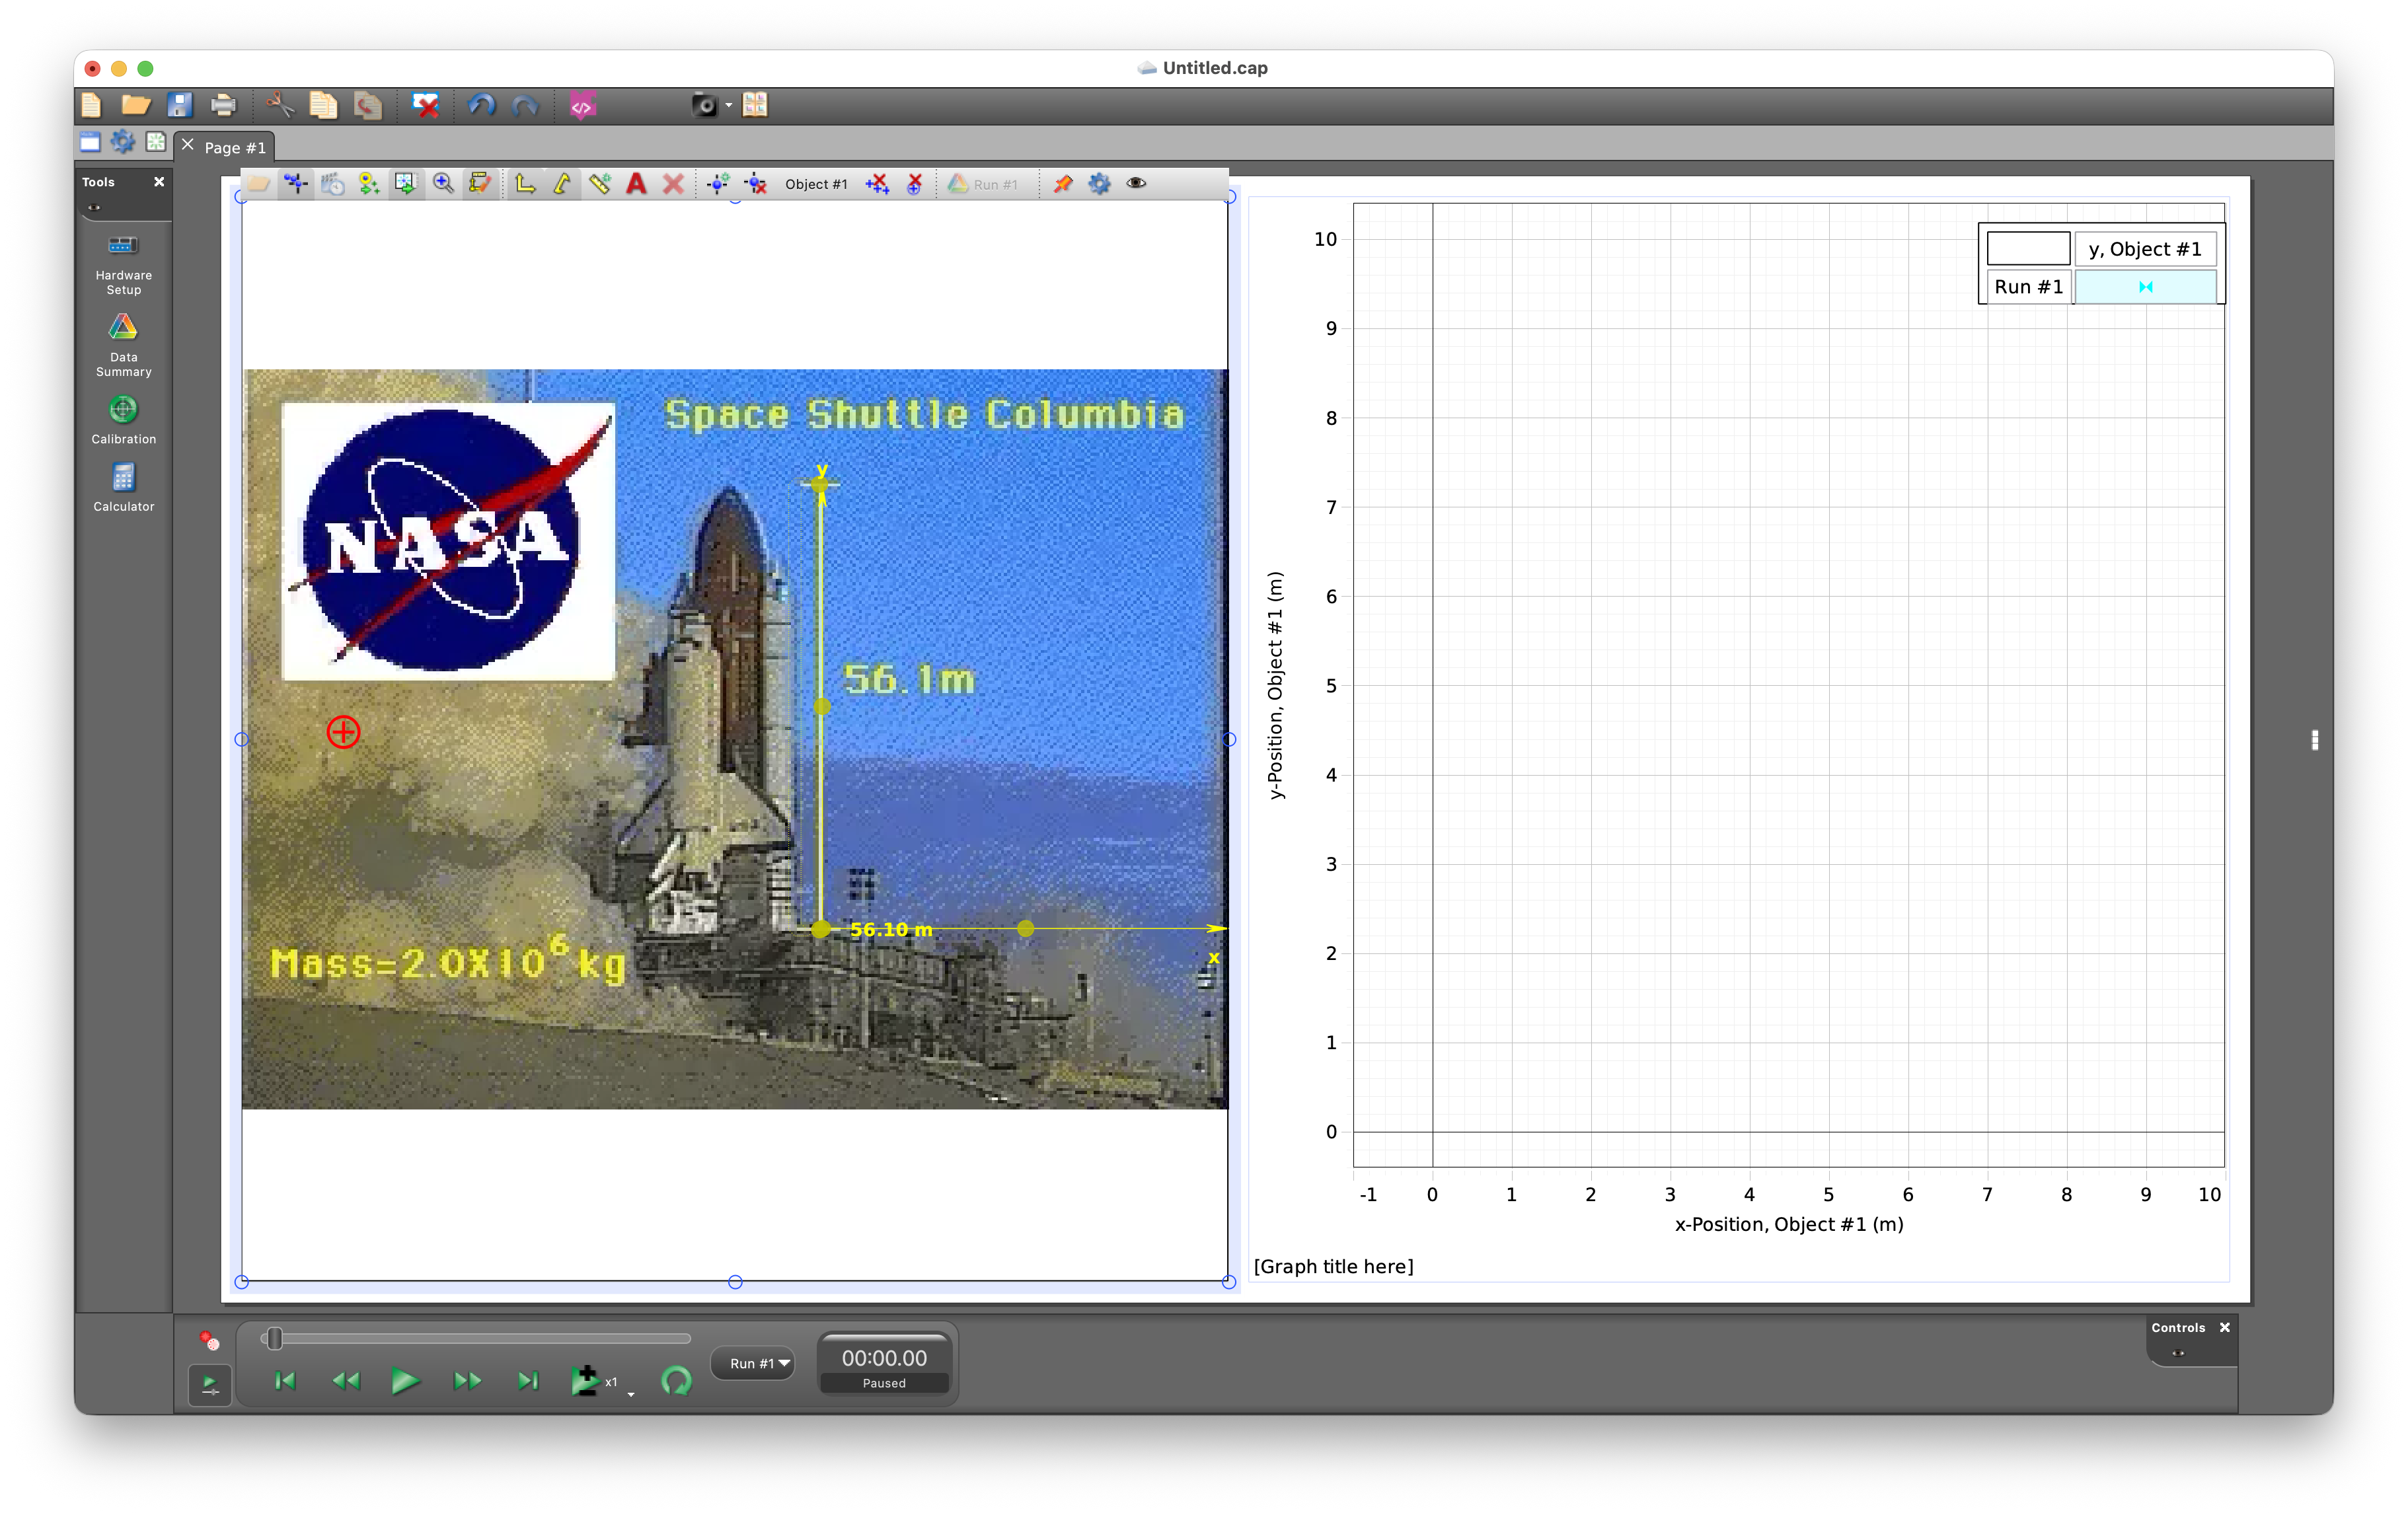
- You can move the origin of the coordinate system to a different position (I moved it to the bottom of the bar that shows the height of the shuttle).
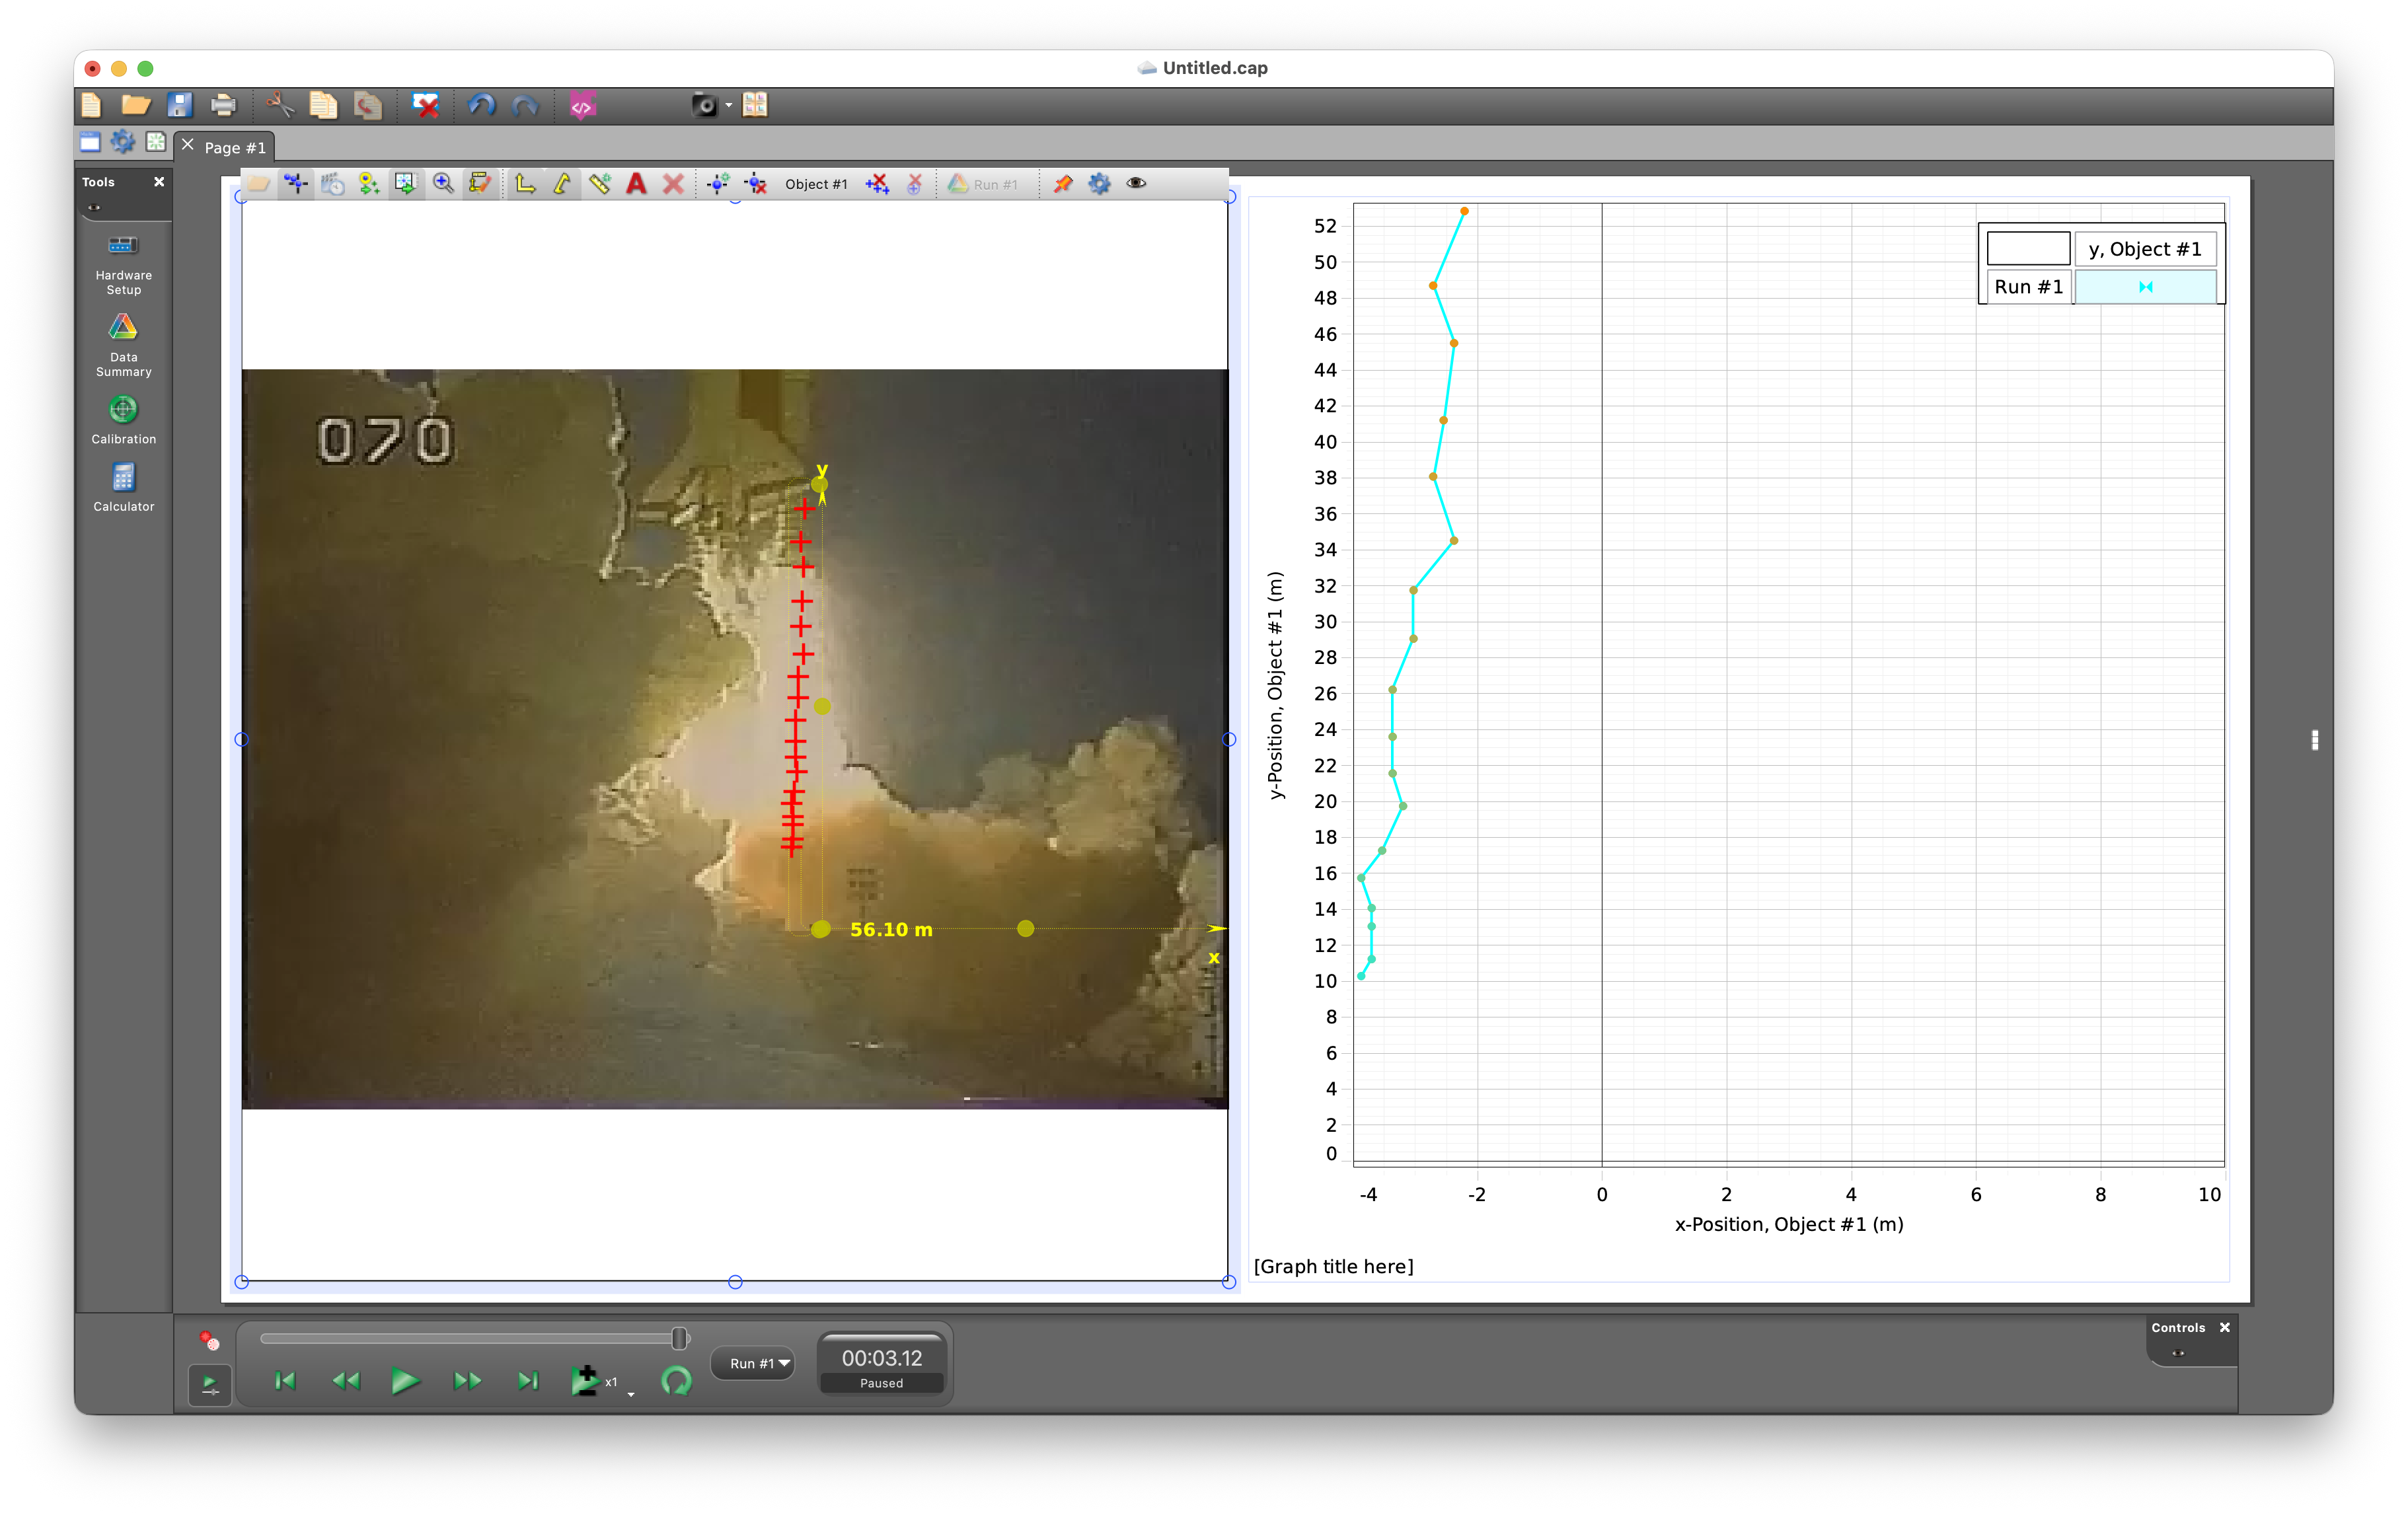
- You are now ready to start tracking the motion. Move your mouse to your reference point (picking a point that remains visible in the entire movie). Click on it. A red cross will appear and the video will advance by one frame. Repeat this process until you have reached the end of the video. As you click, the data points are show on the graph on the right-hand side.
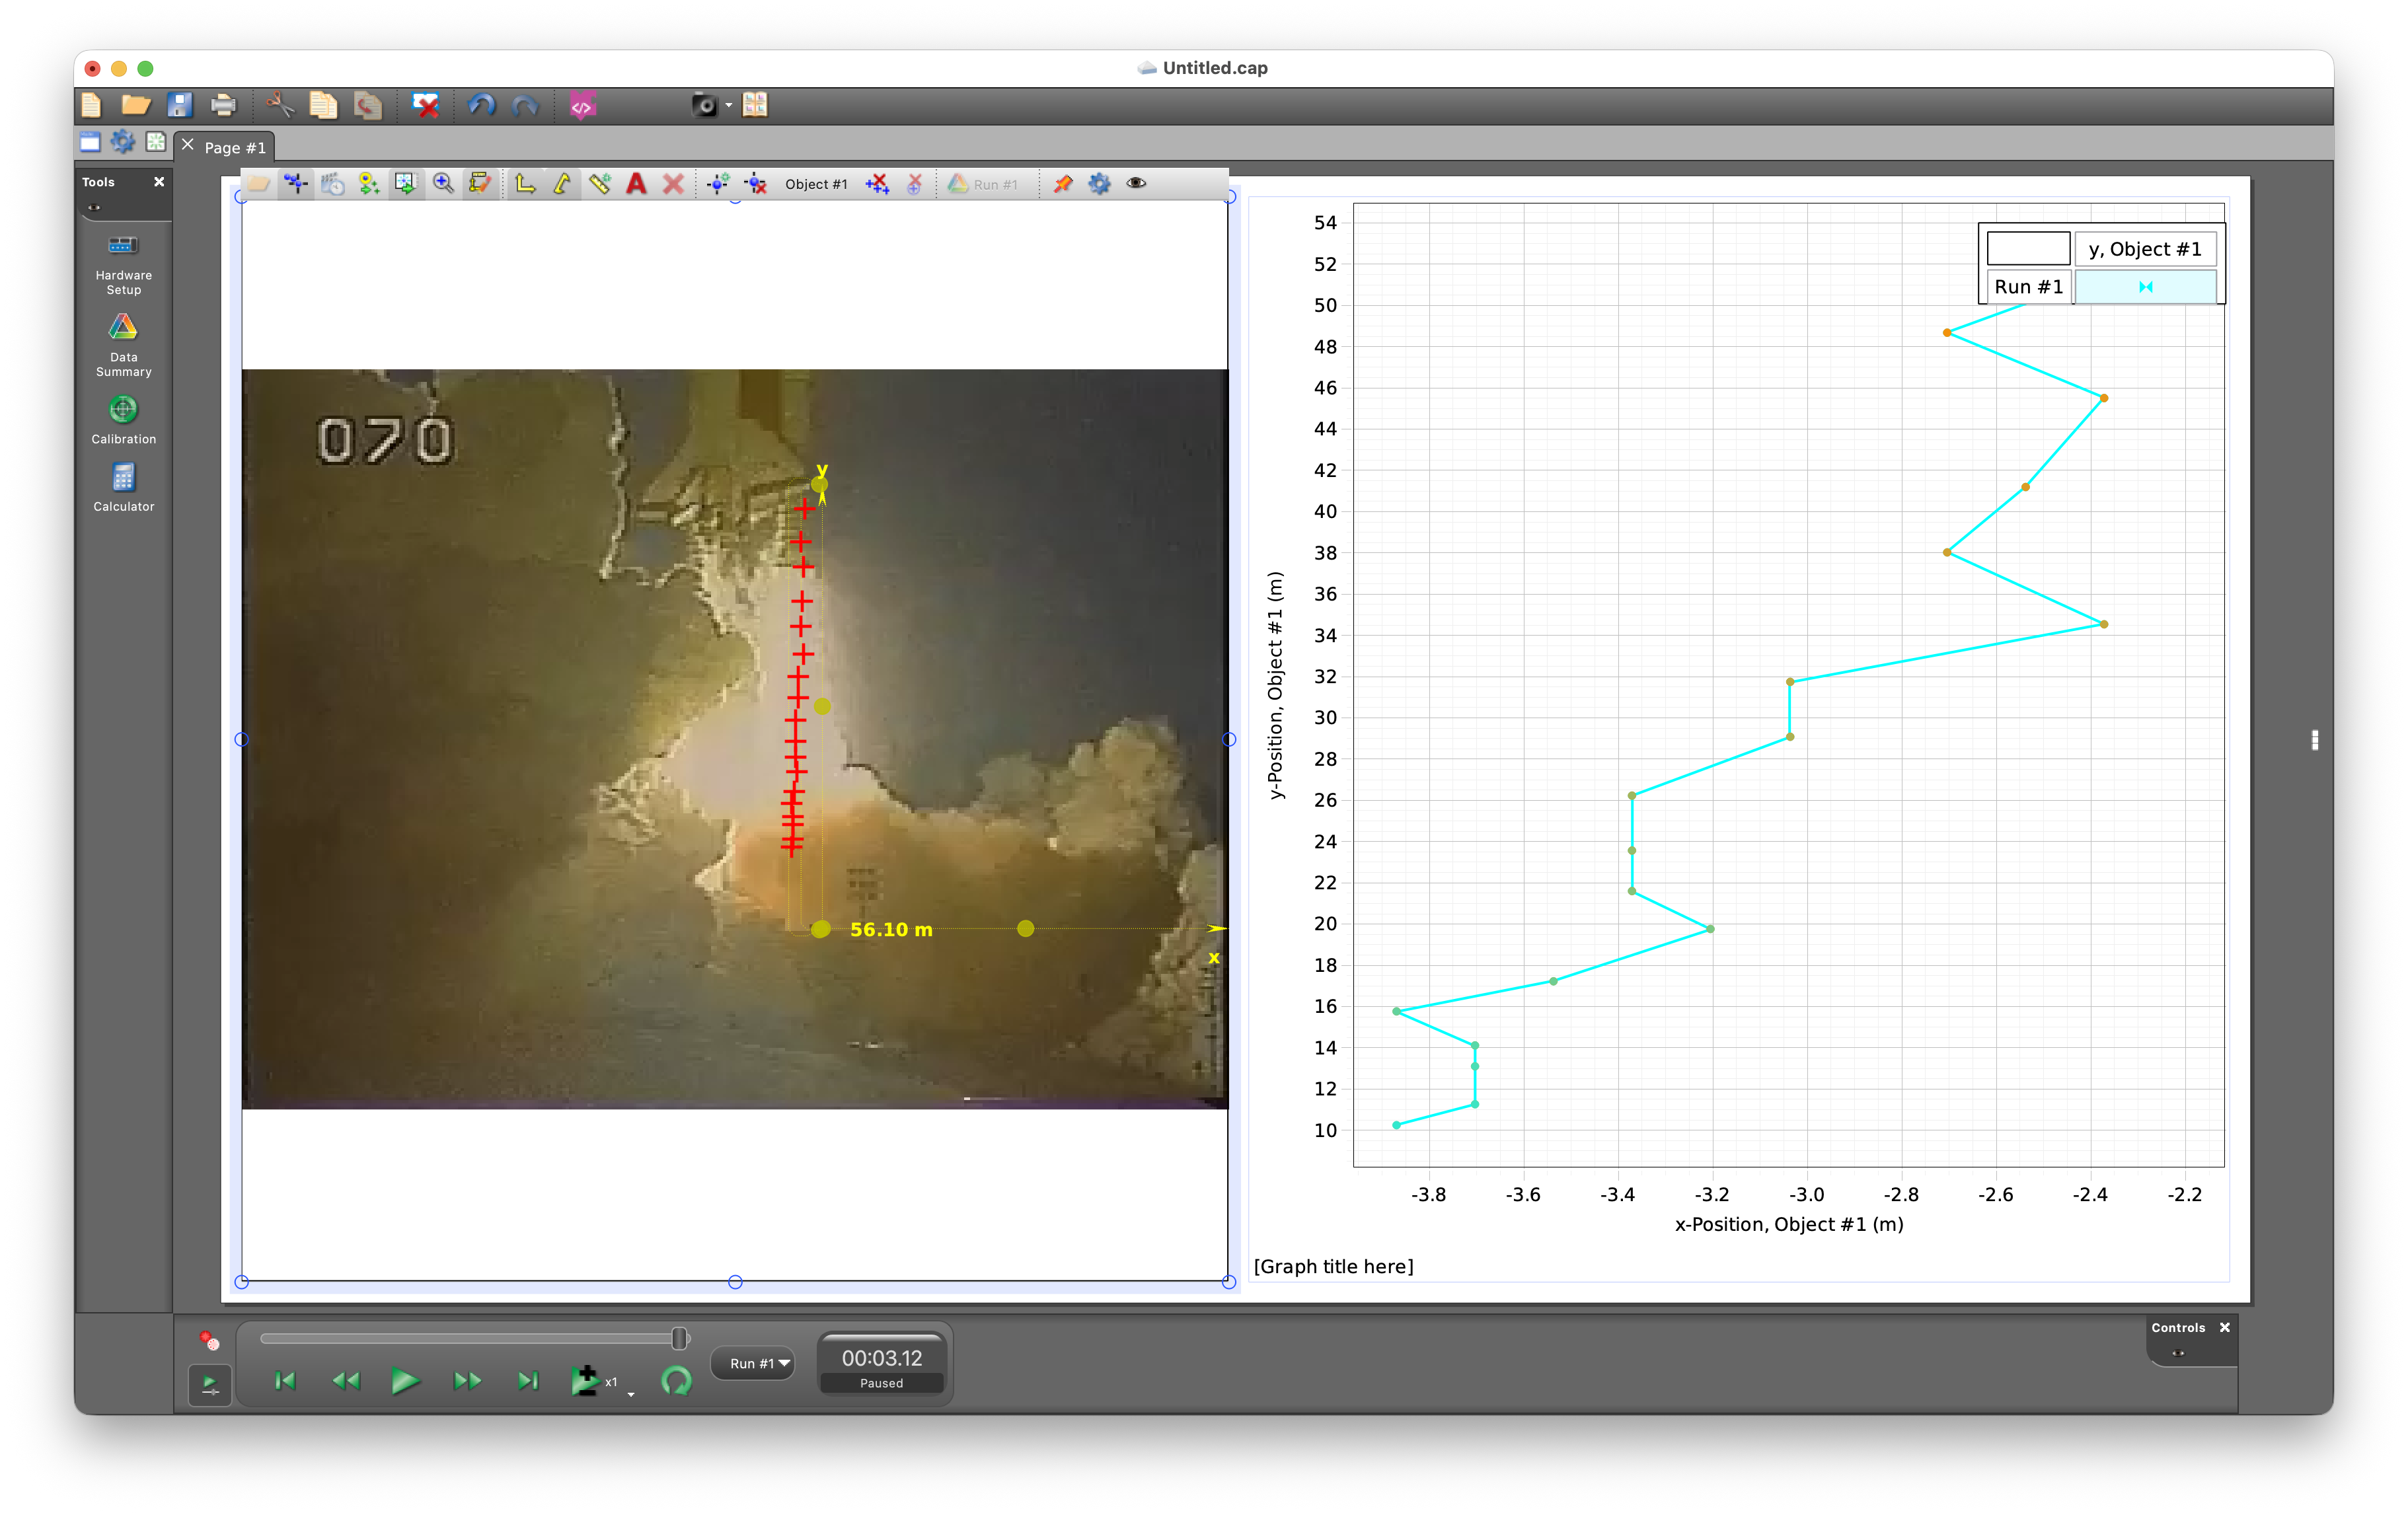
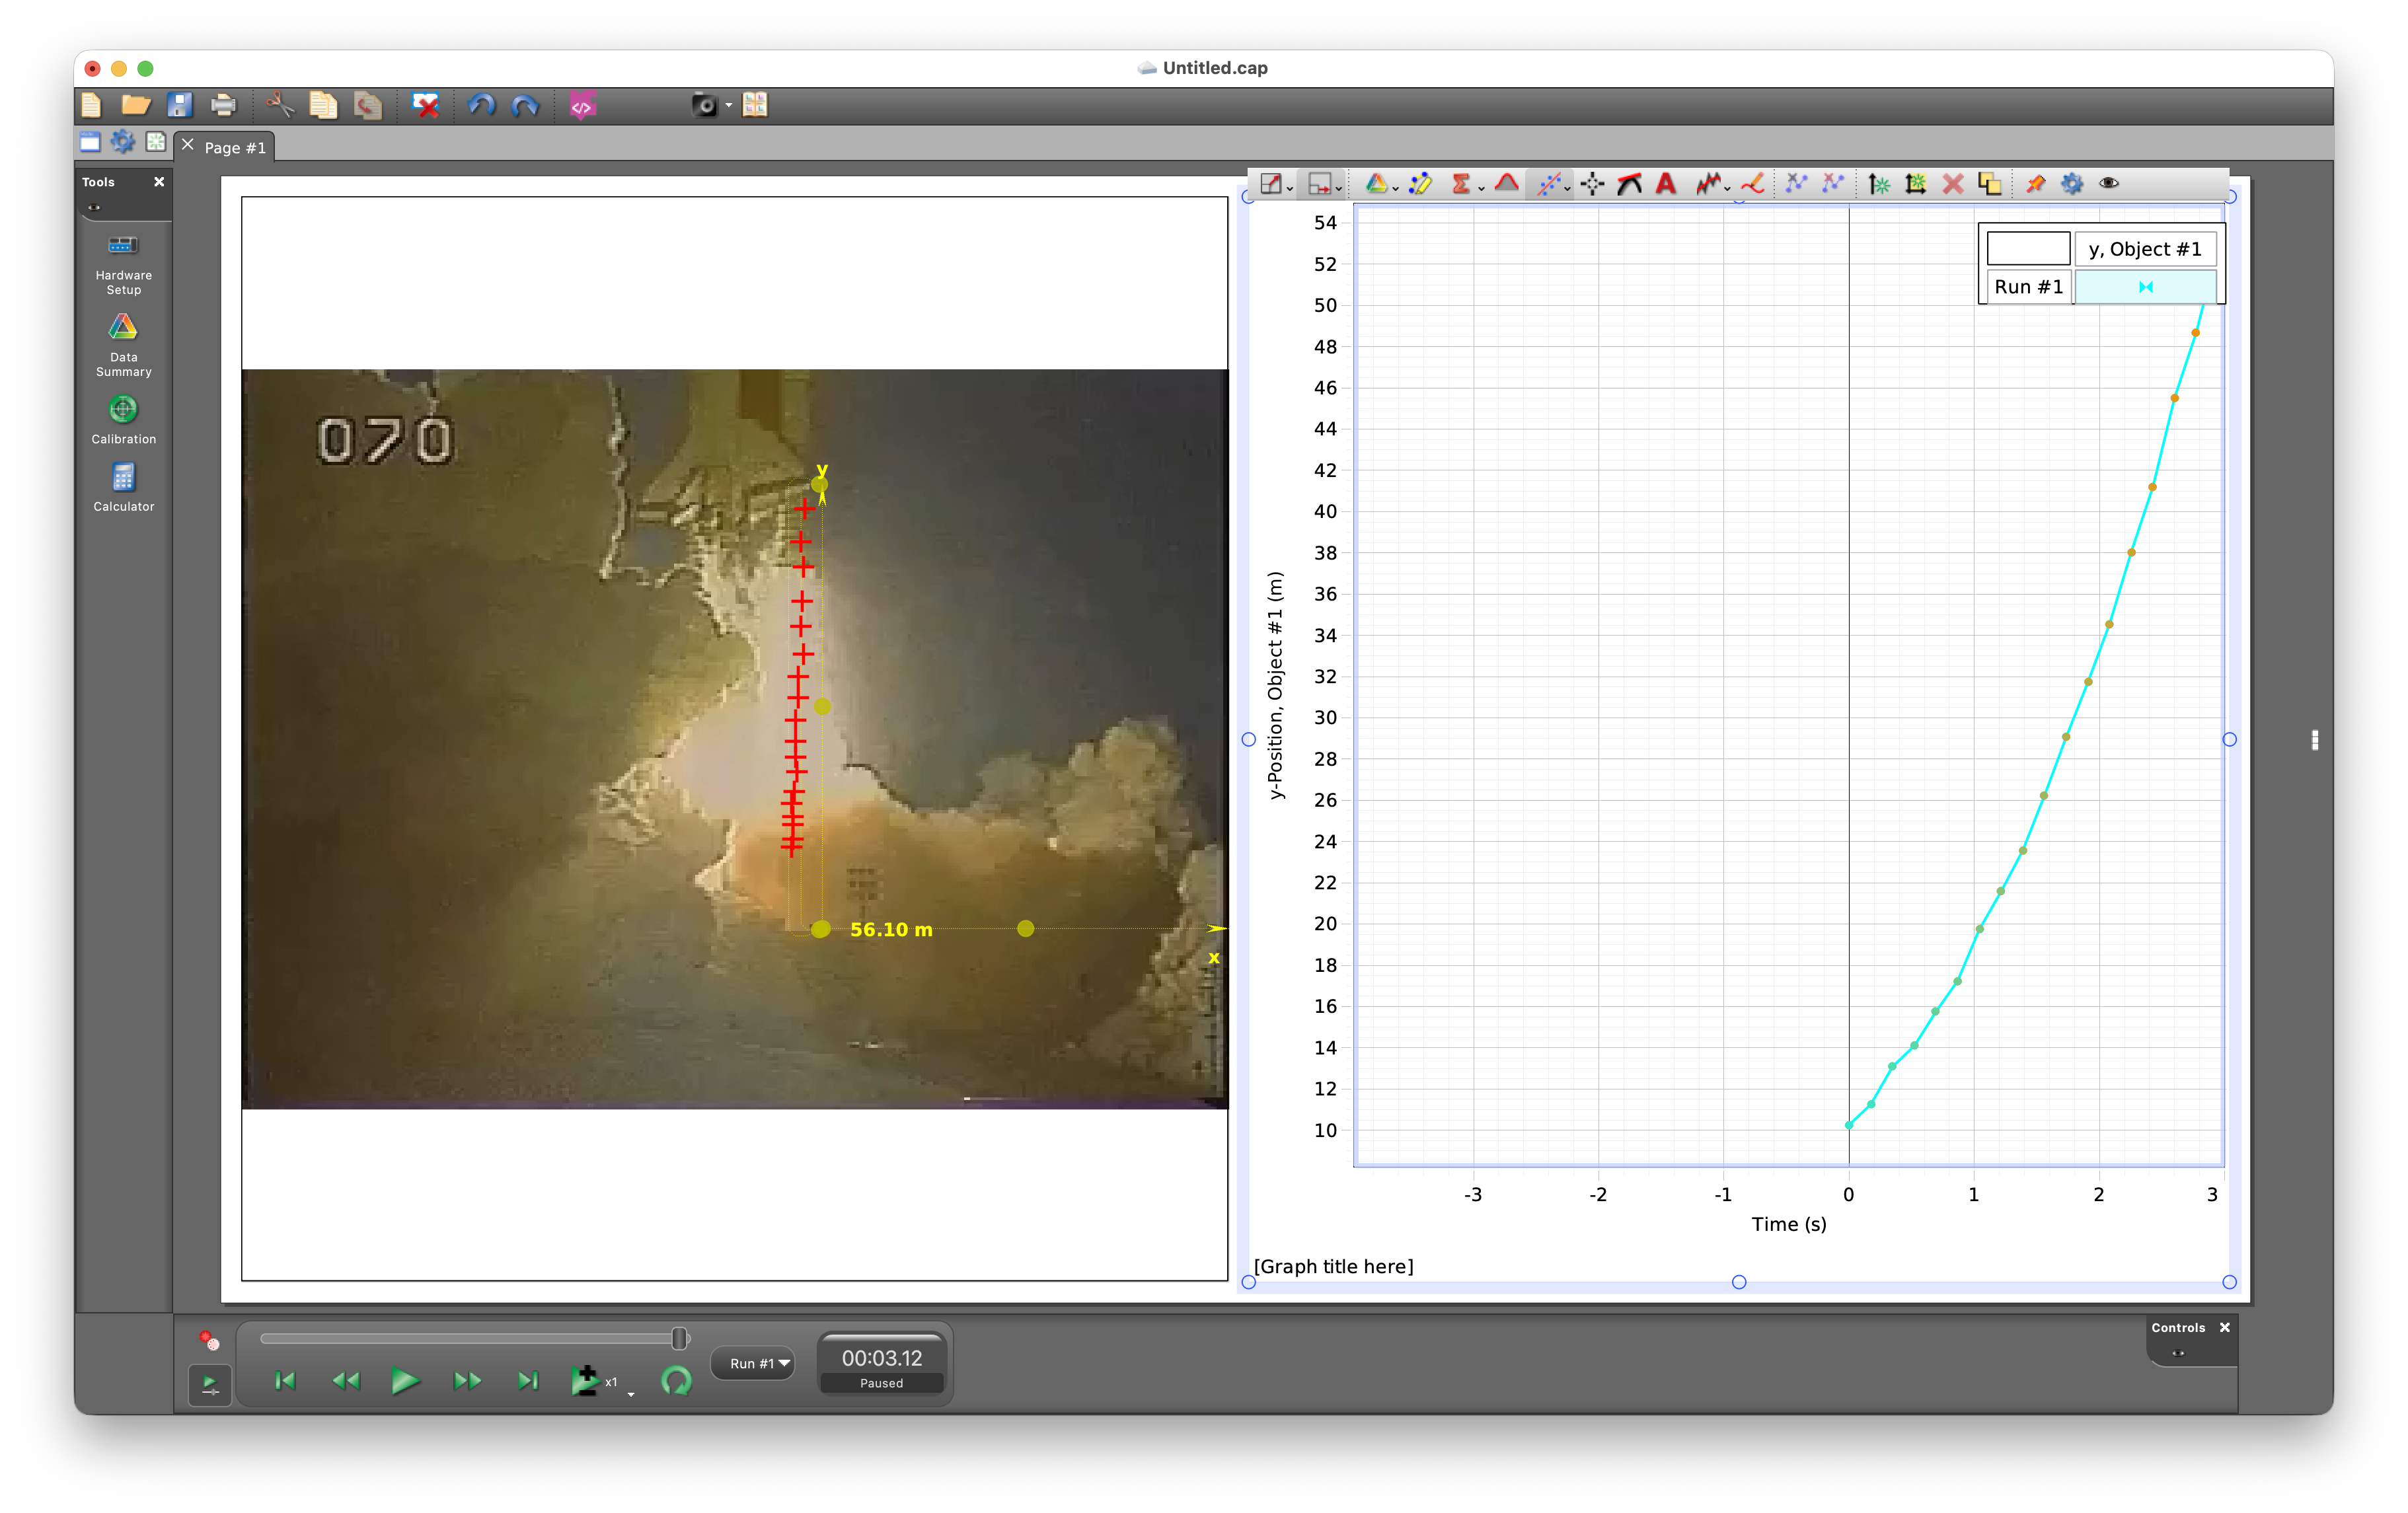
- If you point at the graph, a series of button appears on the top. Select the left most button: "Scale axes to show all data". The scale of the graph is now adjusted to show all data (and reduce the amount of white space).
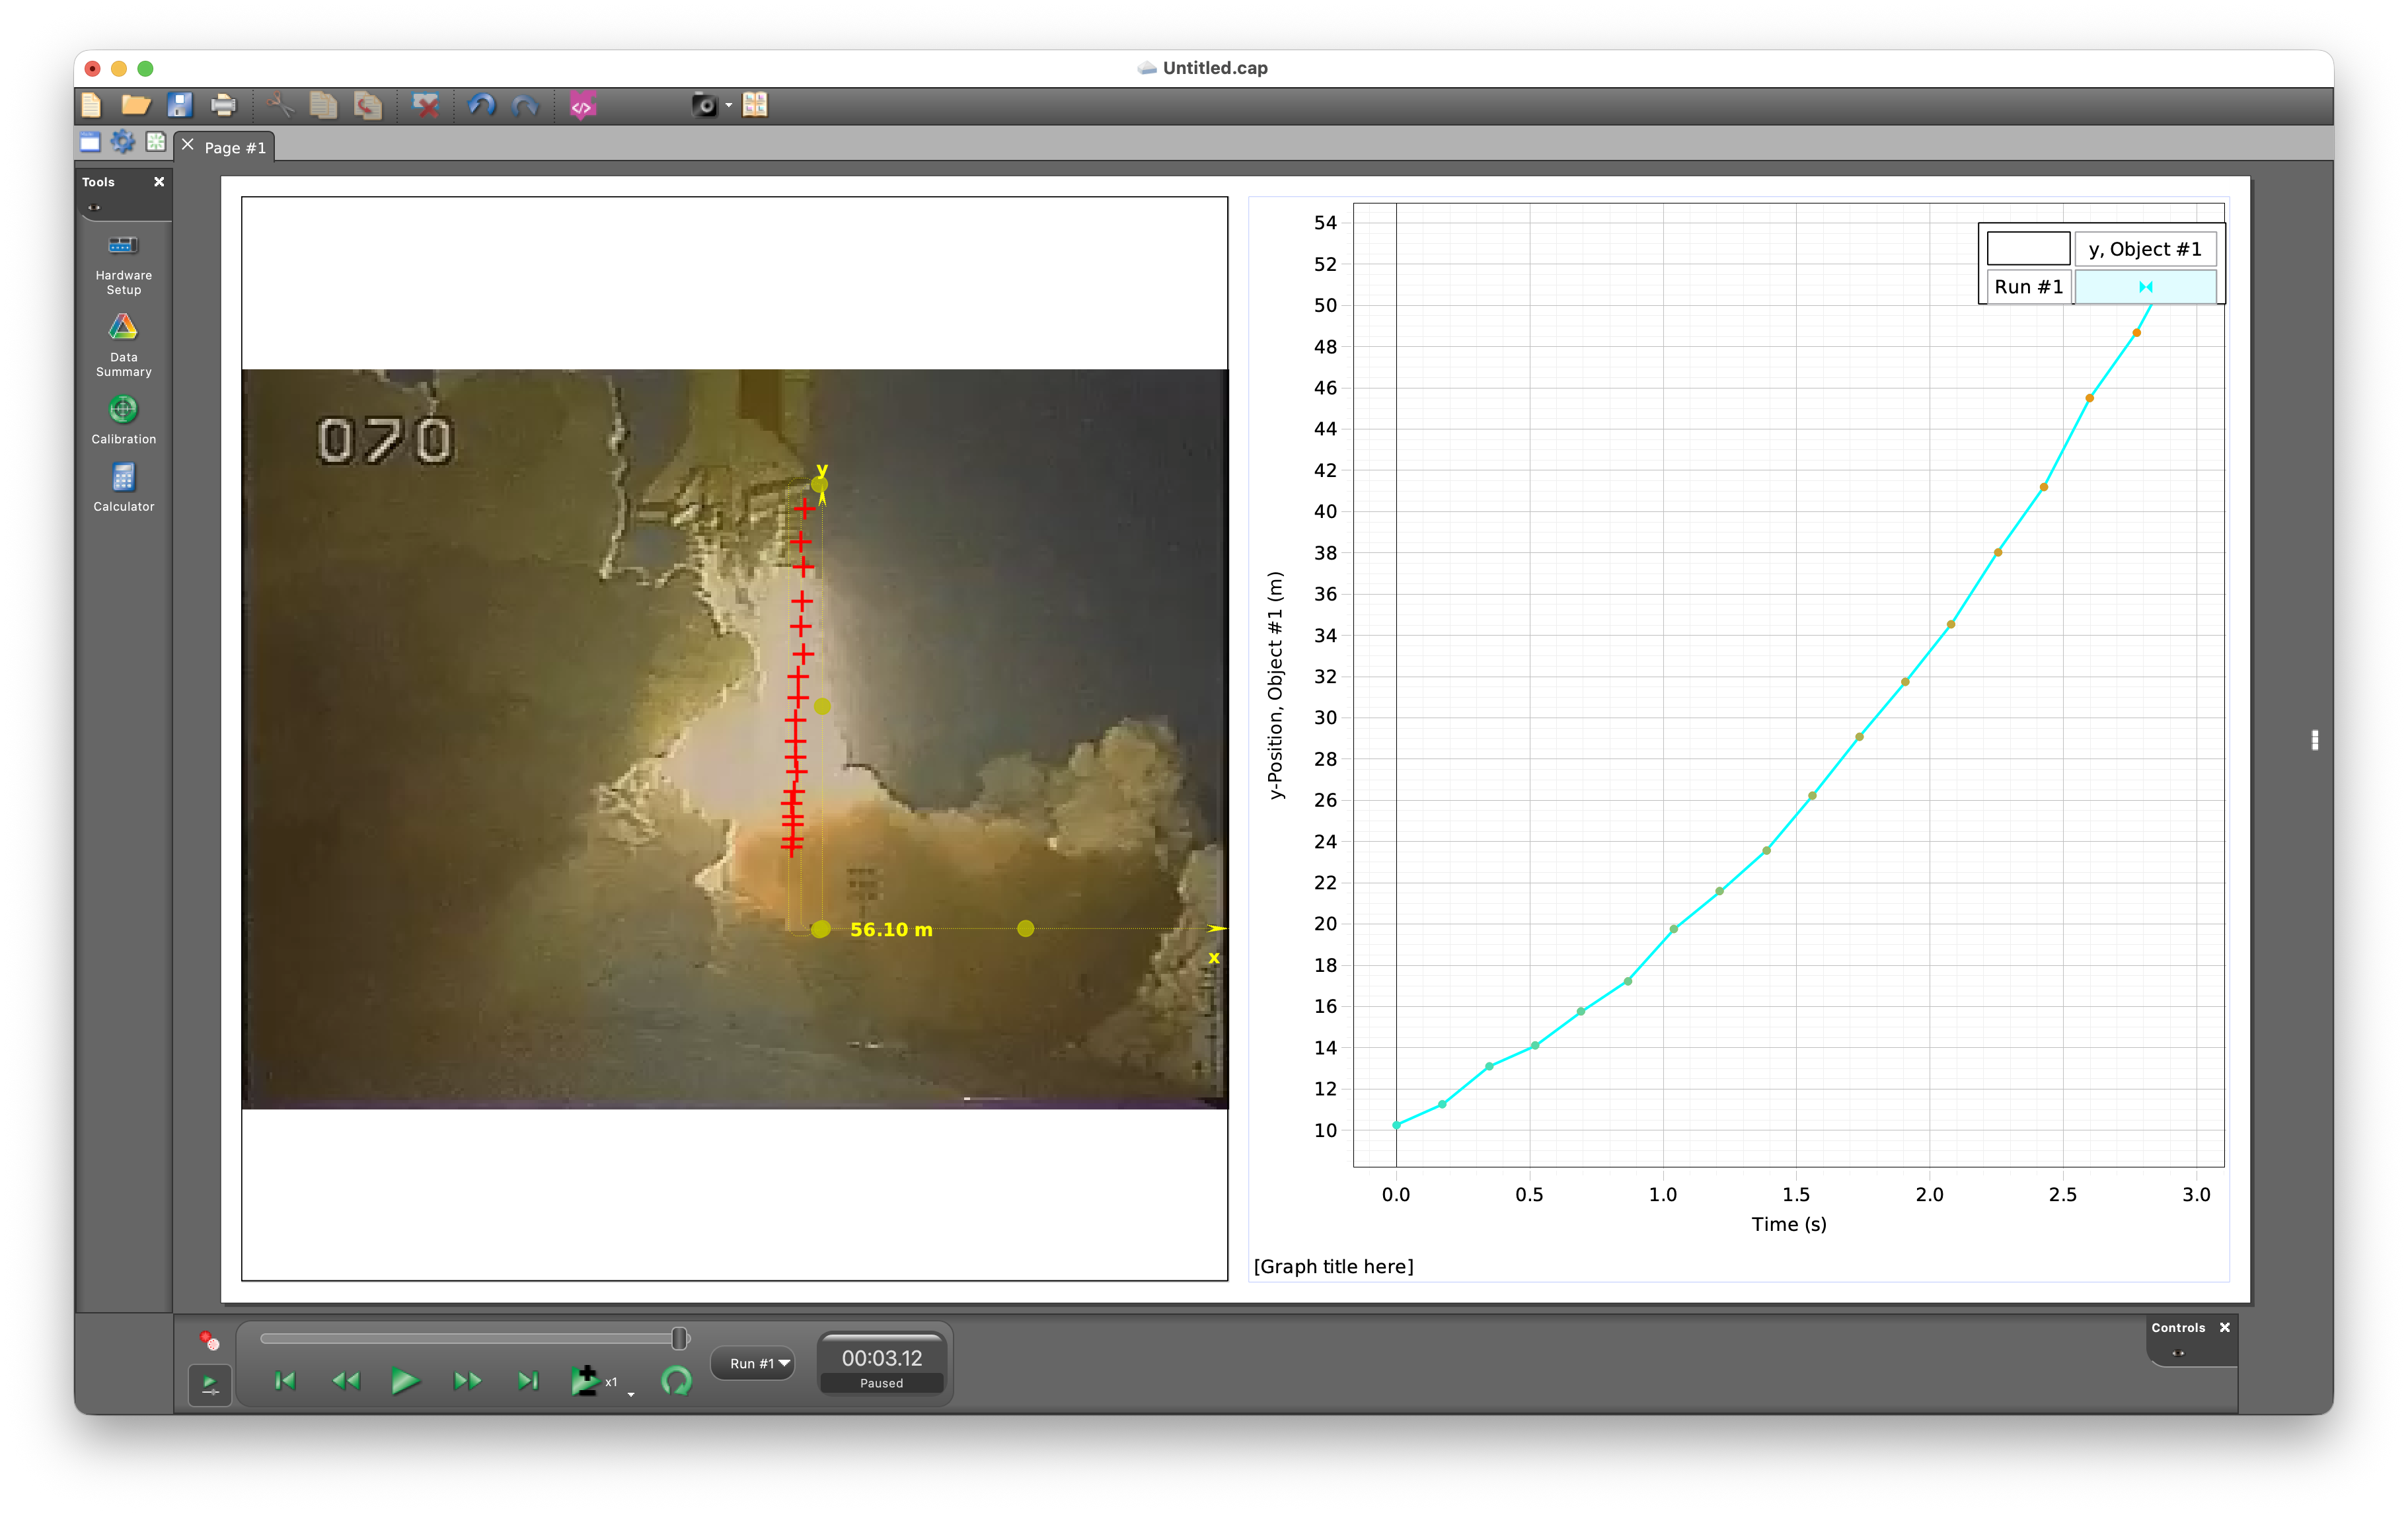
- Click on the x axis label to change what is shown on the x axis to time. You will need to scale the axes again to see all yhour data.
- Click on the y axis label to change what is shown on the y axis to the y veliocity. You will need to scale the axes again to see all yhour data.
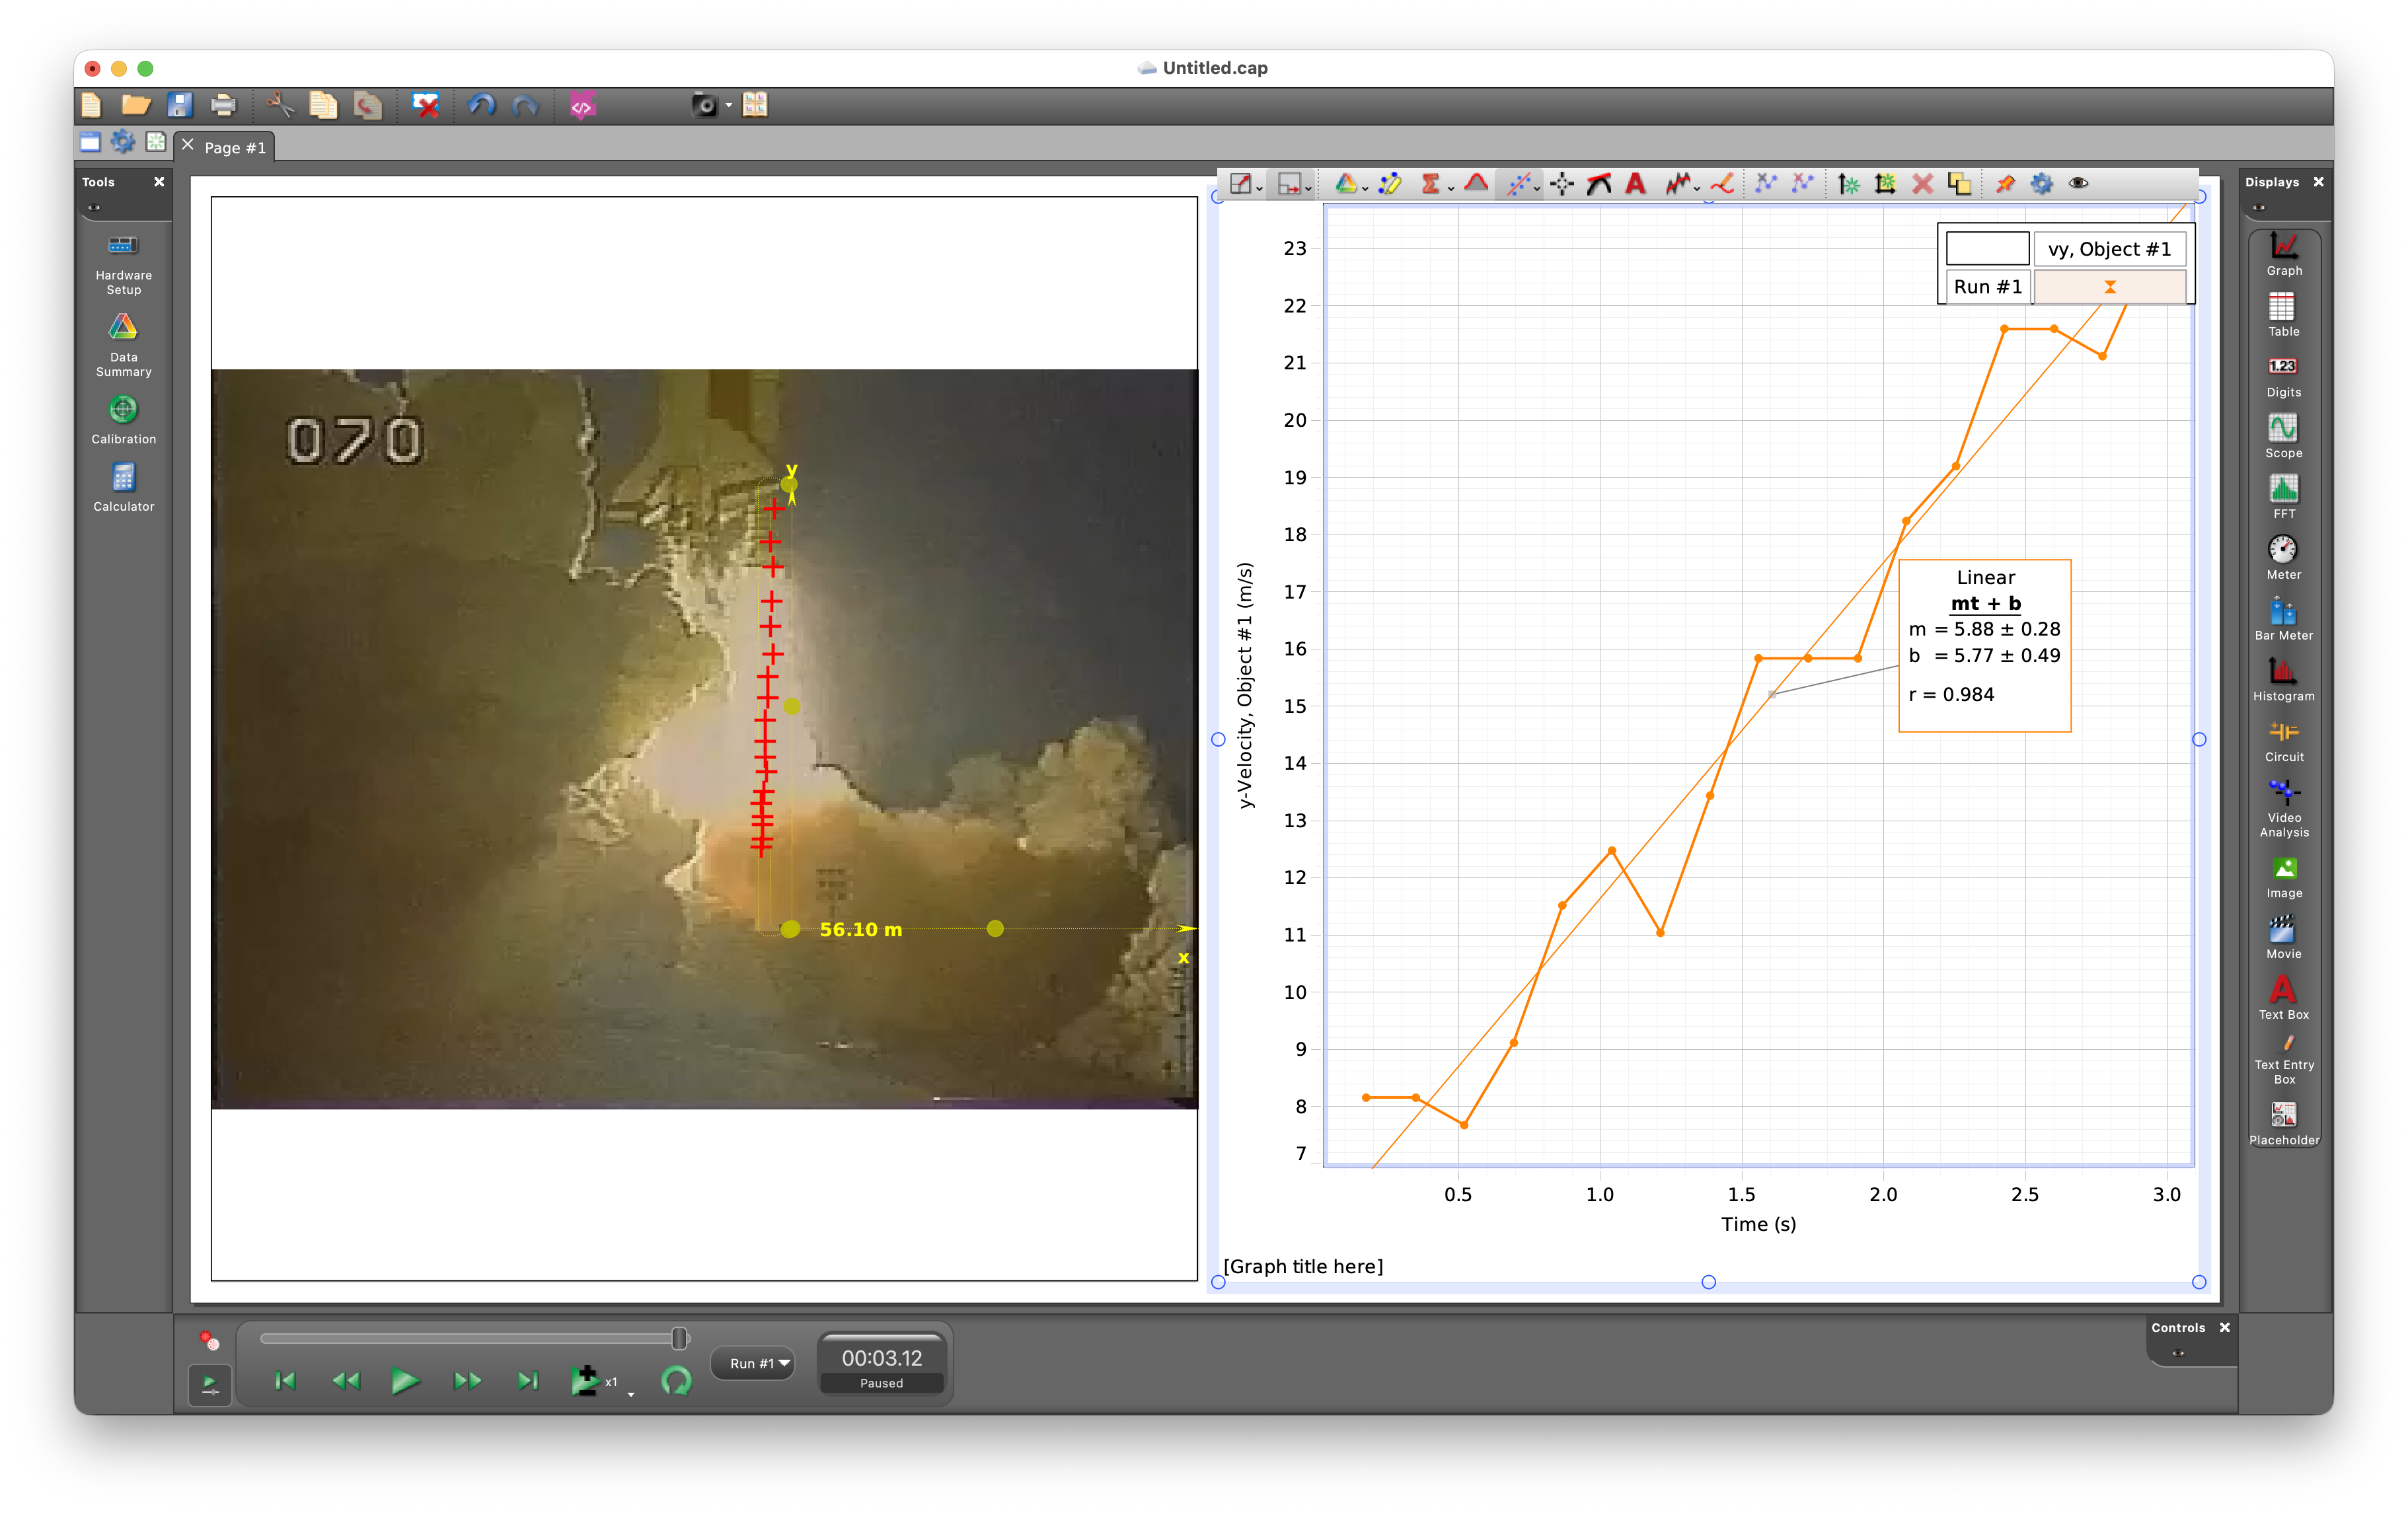
- Clcik on the seventh button from the left to fit a function to the data. For constant acceleration we expect a linear relation between the velocity and time.
Details on the software can be found on the Pasco website. The following links are relevant:
Last updated on
Saturday, August 8, 2026 18:05