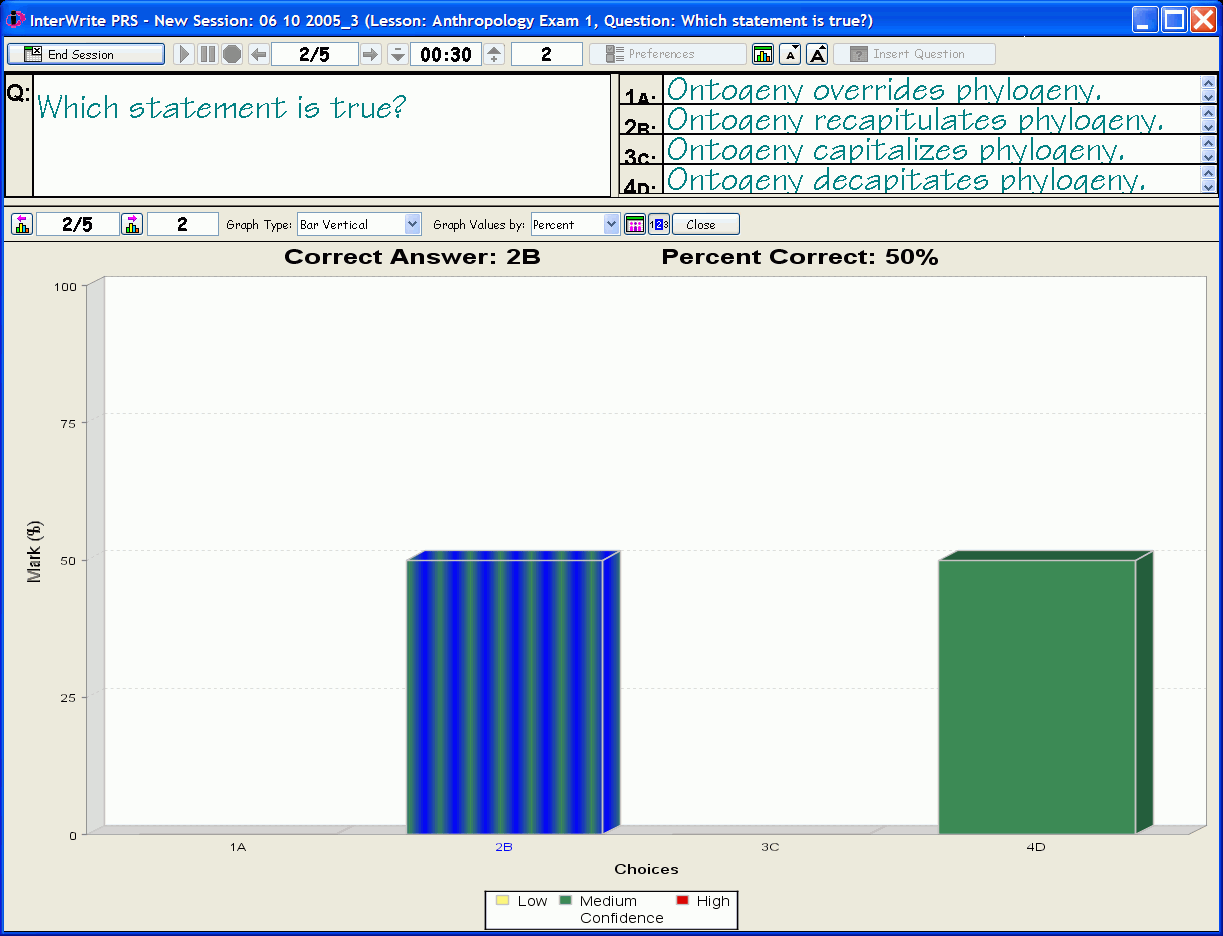
Results Graph Window
The Results Graph can be set
up to display automatically (New
Class definition, Graph Window Defaults tab), or to display only when
the Show Graph  Function
Button on the Session dialog Toolbar
is clicked. The Results Graph shows the distribution of the Responses
to the Question identified in the .
Typically, the Results Graph shows the number of the Question being graphed,
the total number of unique Responses to the Question, and the correct
Response, shown both in the color of the bar and in the graph legend.
The settings in the Graph Type and Graph Values by fields located on the
Results Graph Toolbar will influence how the Results Graph is displayed.
These values are initially set in the New Class definition, Graph Window
Defaults tab. You can change either setting for this Question's Results
Graph by making another selection from the drop-down list.
The Confidence legend below
the Results Graph shows which Confidence
Level the different color bars represent, Medium
being the default Confidence Level. The Percent of Responses that were
correct is displayed above the Results Graph.
Click on the Function Buttons in the Results Graph Toolbar to learn
more about these options.

 Function
Button on the Session dialog Toolbar
is clicked. The Results Graph shows the distribution of the Responses
to the Question identified in the Question Indicator box.
Typically, the Results Graph shows the number of the Question being graphed,
the total number of unique Responses to the Question, and the correct
Response, shown both in the color of the bar and in the graph legend.
The settings in the Graph Type and Graph Values by fields located on the
Results Graph Toolbar will influence how the Results Graph is displayed.
These values are initially set in the New Class definition, Graph Window
Defaults tab. You can change either setting for this Question's Results
Graph by making another selection from the drop-down list.