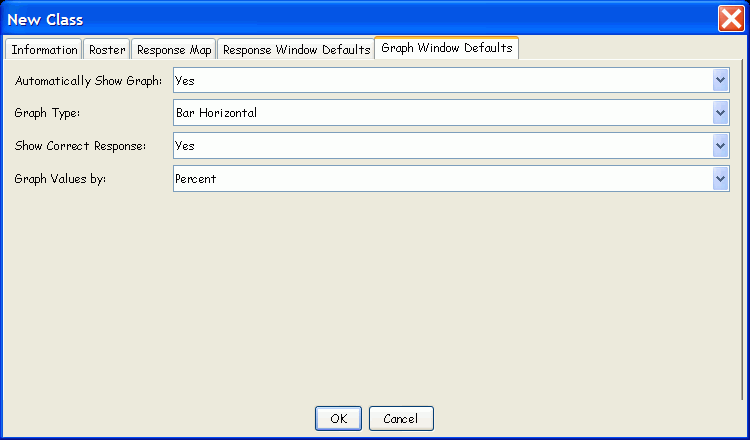

Responses can be graphed to provide visual feedback on the Response
distribution for each Question during a Session. The Results Graph is
displayed automatically, or manually, following each Question, depending
on this dialog's settings. To manually display the Results Graph, click
on the Show Graph Function Button
 . The following table describes the Results
Graph settings.
|
Option |
Settings |
Description |
|
Automatically Show Graph |
Yes/No |
Do you want a graph of the Response distribution for each Question to automatically display after the Question? |
|
Graph Type |
Bar Vertical |
Select the type of display graph you prefer. You can change this option during a Session when the Results Graph is displayed. |
|
Show Correct Response |
Yes/No |
When this option is set to Yes, the number of the correct Response is displayed in the graph legend in bright blue and the color of the correct Response's graph bar is combined with bright blue. |
|
Graph Values by |
Percent |
Percent: The results are graphed based on the percentage of Responses for each Response Choice. Number: The results are graphed based on the actual number of Responses for each Response Choice. |