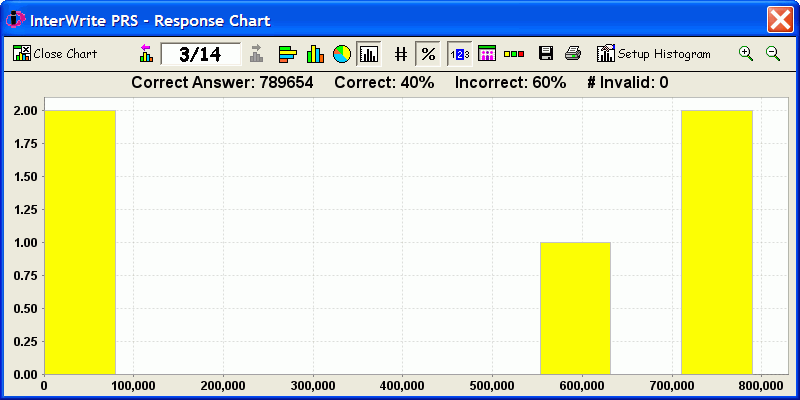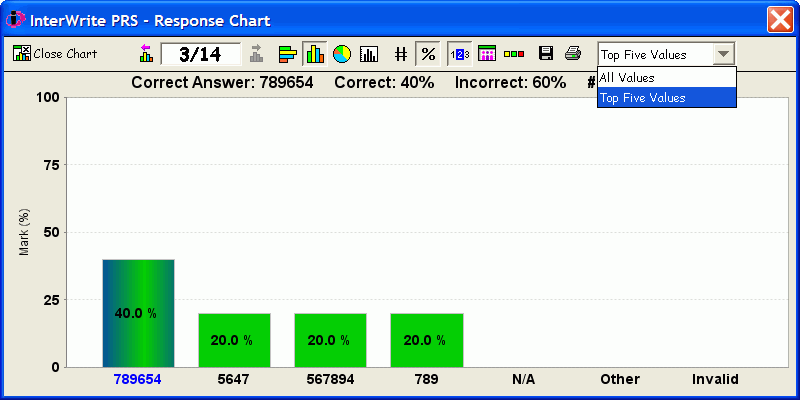
The default Response Chart for Numeric Questions is the Histogram. You can view Numeric Response data in the other chart formats by selecting one of the other charting tools on the Response Chart Toolbar, but the Histogram will appear by default.
Click on a tool or menu selection in either of the sample screen shots below to learn more about the tool's functionality.

