NOTE
This manual describes the laboratory experiment used during the 1996 - 1997 academic year. Significant changes have been made since then, and the manual used during the current academic year is in NOT available yet on the WEB. Hardcopies can be purchased at the bookstore.
To verify the quantum nature for the Balmer series, specifically for hydrogen and sodium.
One of the earliest successes of quantum mechanics was the explanation of the spectrum of atomic hydrogen. It has long been known that atomic hydrogen had some regular features in its spectrum. These regularities can be expressed as,
![]() , (1)
, (1)
where ![]() are both integers and R
is a constant. The spectral lines are classified into series which
are sets of lines with a common value of the integer
are both integers and R
is a constant. The spectral lines are classified into series which
are sets of lines with a common value of the integer ![]() . Thus
we have written the expression as the wave number (inverse wavelength
usually quoted in units of cm-1) of the
. Thus
we have written the expression as the wave number (inverse wavelength
usually quoted in units of cm-1) of the ![]() member
of the
member
of the ![]() series. The various series
of the spectrum of atomic hydrogen are listed in Table 1.
series. The various series
of the spectrum of atomic hydrogen are listed in Table 1.
According to the Bohr theory (and of more formal quantum mechanics), the Rydberg constant R is given to a first approximation by,
![]() (2)
(2)
where e and m are the electron charge and mass,
respectfully, c is the velocity of light, is Planck's constant
divided by 2[[pi]], and ![]() .
You may find an elementary discussion of the derivation of this
expression in many texts (e.g. Eisberg's Fundamentals of Modern
Physics, Chapter 5, sections 1, 2, and 3). There is a small
correction which takes into account the mass M of the nucleus.
This involves replacing m with a reduced mass u given by,
.
You may find an elementary discussion of the derivation of this
expression in many texts (e.g. Eisberg's Fundamentals of Modern
Physics, Chapter 5, sections 1, 2, and 3). There is a small
correction which takes into account the mass M of the nucleus.
This involves replacing m with a reduced mass u given by,
![]() (3)
(3)
Name Wavelength Range Series Expression --------------------------------------------------------------------------- Lyman UltravioletBalmer Near UV & Visible
Paschen Infrared
Brackett Infrared
Pfund Infrared
---------------------------------------------------------------------------
Table 1
Examine the spectrum of atomic hydrogen in the visible region.
This will restrict your test of the theory to three or four lines
of the Balmer Series, examine the chart on the wall of the laboratory
which should be sufficient to verify the quantum nature of the
expression for the Balmer series and allow you to obtain a value
of the Rydberg Constant using the series expression given in Table
1.
The prelab homework must be done at home and handed to TA before you start the lab. Read the lab instructions for this lab.
Write down the ranges of the wavelengths in nanometers(nm) for the regions of the spectrum usually designated by x-ray, ultraviolet, visible, infrared and microwave, radio.
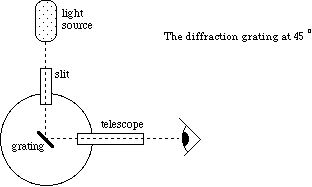
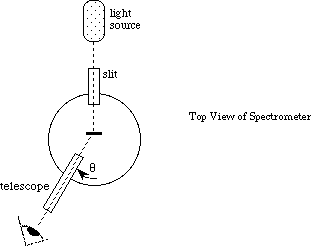
The spectrometer needs to be aligned to ensure decent measurements of the sodium, also on the chart on the wall, and hydrogen spectral lines. The spectrometer is shown in Figure 1. Below the telescope there is a pair of knobs. If you loosen the top knob, then the telescope will be free to move. Loosening the bottom knob allows the platform to rotate. If you rotate the platform, then the angles visible in the window on the platform will change. Keep careful track of these changes.

Figure 1

Figure 2

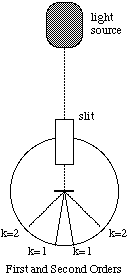
Figure 3
Light passing through the diffraction grating is diffracted into directions [[theta]] given by,
![]() , (4)
, (4)
where d is the spacing between the lines on the grating, k is an integer, [[lambda]] is the wavelength of light, and [[theta]] is measured from the normal to the grating. (Figure 4).

Figure 4

Figure 5
From your data determine the wavelengths of the observed lines,
and fit these to the ![]() obtained from
the Balmer series expression for n=3,4 & 5.
obtained from
the Balmer series expression for n=3,4 & 5.
Ordinary hydrogen has a nucleus consisting of one proton. Naturally occurring hydrogen, however, contains a small amount of deuterium, i.e., hydrogen having a nucleus consisting of a proton and a neutron. If the deuterium existed in sufficient quantity in your source to produce observable spectral lines, would you expect to resolve its lines from those of ordinary hydrogen with our equipment?