Weighted mean
The calculation of the mean discussed in the handout assumes that the standard deviation of each individual measurement is the same. This is a correct assumption if the same technique is used to measure the same parameter repeatedly. However, in many applications it is necessary to calculate the mean for a set of data with different individual errors. Consider for example the measurement of the spring constant discussed in the handout. Suppose the standard deviation in the measurement of the force is 0.25 N and the standard deviation in the measurement of the elongation is 2.5 cm. The error in the calculated spring constant k is equal to:
![]()
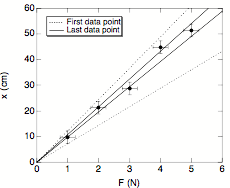
For the first data point (F = 1.0 N and x = 9.7 cm) the standard deviation of k is equal to 0.037 N/cm. For the last data point (F = 5.0 N and x = 51.5 cm) the standard deviation of k is equal to 0.007 N/cm. We observe that there is a substantial difference in the standard deviation of k obtained from the first and from the last measurement. Clearly, the last measurement should be given more weight when the mean value of k is calculated. This can also be illustrated by looking at a graph of the measured elongation x as a function of the applied force F (see Figure 1). The theoretical relation between x and F predicts that these two quantities have a linear relation (and that x = 0 m when F = 0 N). The data points shown in Figure 1 have error bars that are equal to ± 1s. The dotted lines in Figure 1 illustrate the range of slopes that produces a linear relation between x and F that does not deviate from the first data point by more than 1 standard deviation. The solid lines illustrate the range of slopes that produces a linear relation between x and F that does not deviate from the last data point by more than 1 standard deviation. Obviously, the limits imposed on the slope (and thus the spring constant k) by the first data point are less stringent than the limits imposed by the last data point, and consequently more weight should be given to the last data point.
The correct way of taking the weighted mean of a number of values is to calculate a weighting factor wi for each measurement. The weighting factor wi is equal to
![]()
where si is the standard deviation of measurement # i. The weighted mean of N independent measurements yi is then equal to

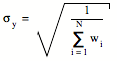
where yi is the result of measurement # i. The standard deviation of the weighted mean is equal to
|
Figure 1. Measured elongation x as a function of applied force F. The various lines shown in this Figures are discussed in the text. |