In this document the first results of a study of the vertexing capabilities of the T0 counters is discussed. The focus will be entirely on comparing the data collected with the T0 counters with the information provided by the vertex detectors. The data used for this analysis were obtained during run 7304.
The vertex information was extracted from the event using .....
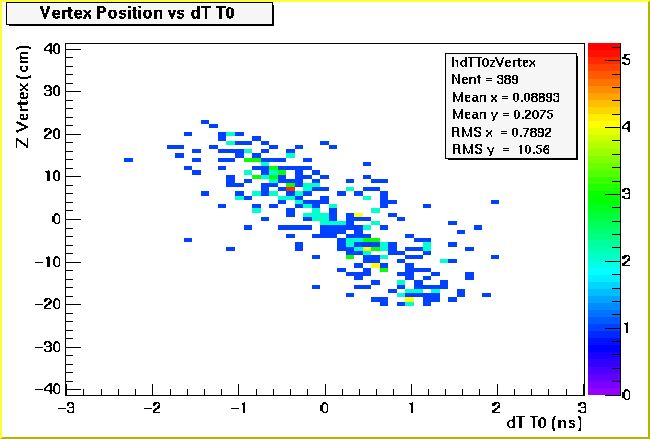
The following figure shows the correlation between the vertex obtained from the vertex counters and the time difference between the first time signal produced with the positive and negative T0 counters.
Vertex position (obtained from information provided by the vertex detector) as function of the time difference between the positive and negative T0 counters. The events used in this analysis are the events from sequence 000 from run 7304.
To quantify the vertexing capabilities of the T0 counters, we have calculated the difference between the vertex position obtained from the vertex counters and the vertex position obtained from the T0 counters ( = (1/2) * c * dT). A histogram of this difference, for all events shown in the figure above, is shown in the figure below.
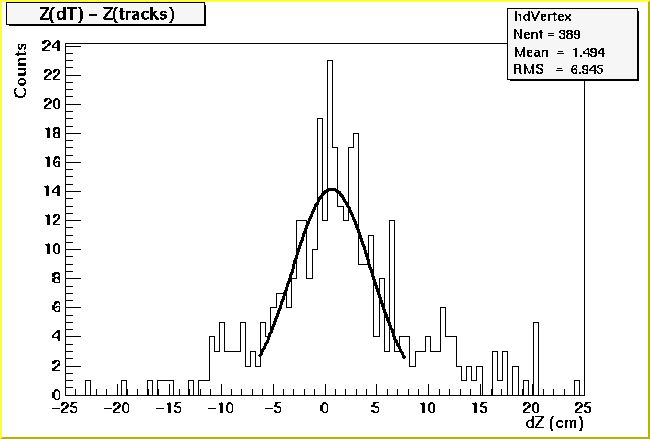
Difference between the vertex obtained from the vertex detectors and the vertex obtained from the T0 counters.
The vertex difference is peaked close to 0, and a Gaussian fit to the data shows that the resolution of the reconstructed vertex is 3.4 cm (1 sigma). The distribution is centered at +0.77 cm.
In order to improve the vertexing capabilities of the T0 counters, the collision date were used to fine tune the offsets of the individual T0 counters. We selected events that were tagged as collisions ( e->IsCollision() ) and required that a valid vertex was found. For these events we constructed the time difference spectra between counters 1, 2, and 3, and our reference counter 0, on both positive and negative sides. The required adjustments are shown in the following table:
|
Counter
|
Additional Timing Shift (ns)
|
|
T0P0
|
0
|
|
T0P1
|
-0.342
|
|
T0P2
|
-0.283
|
|
T0P3
|
-0.085
|
|
T0N0
|
0
|
|
T0N1
|
-0.242
|
|
T0N2
|
-0.361
|
|
T0N3
|
-0.168
|
The following figure shows the correlation between the vertex obtained from the vertex counters and the time difference between the first time signal produced with the positive and negative T0 counters after the adjustments listed above were made to the timing signals of the T0 counters.
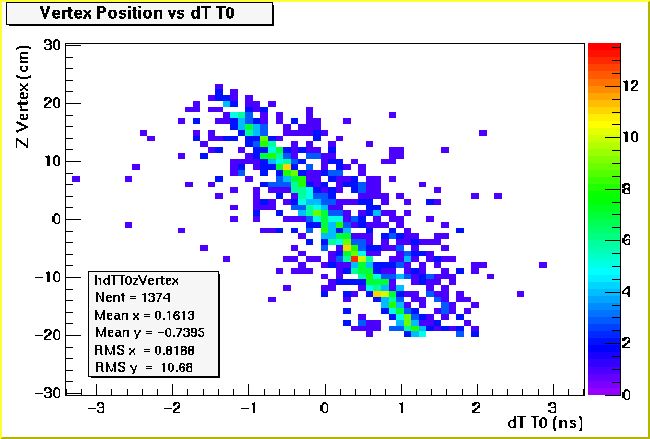
Vertex position (obtained from information provided by the vertex detector) as function of the time difference between the positive and negative T0 counters.
To quantify the vertexing capabilities of the T0 counters, we have calculated the difference between the vertex position obtained from the vertex counters and the vertex position obtained from the T0 counters ( = (1/2) * c * dT). A histogram of this difference, for all events shown in the figure above, is shown in the figure below.
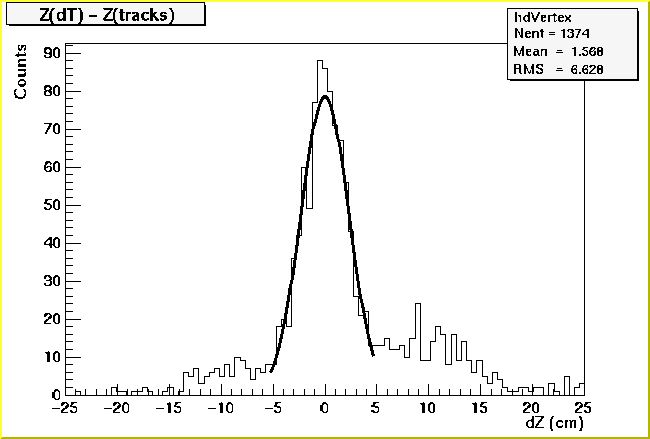
Difference between the vertex obtained from the vertex detectors and the vertex obtained from the T0 counters. The events used in this analysis are the events from sequence 000 from run 7304.
The resolution of the reconstructed vertex is 2.3 cm (1 sigma). This resolution corresponds to a resolution of 150 ps (1 sigma) in the time difference spectrum.
The analysis discussed here is based on the measured time signals, without making slewing corrections. The vertex resolution of 2.3 cm is thus similar to the resolution we can expect to achieve on-line with the T0 counters, assuming all T0 counters are aligned in time. Of course, the nature of the background in the dZ spectrum needs to be investigated further.