In this document the first results of an analysis of the performance of the T0 counters is discussed. The focus will be entirely on comparing the data collected with the T0 counters with the information provided by the paddle counters. The data used for this analysis were obtained during run 7310, during which a nice store was achieved, but the silicon detectors were turned off during this run (thanks George for collecting such a nice data set).
Each T0 counter provides energy and timing information. For the results presented here, a small timing offset has been applied to the measured times to align the various time distributions. The shifts applied are:
|
Counter
|
Timing Shift (ns)
|
|
T0P0
|
+10.10
|
|
T0P1
|
-0.86
|
|
T0P2
|
-0.71
|
|
T0P3
|
-1.18
|
|
T0N0
|
-1.12
|
|
T0N1
|
-0.47
|
|
T0N2
|
+9.04
|
|
T0N3
|
-1.17
|
Note: the large shift of close to 10 ns observed for 2 T0 counters is due to a 10 ns shift in the offsets obtained from time calibration runs (where calibration peaks in the time spectra are separated by 10 ns).
The energy spectrum of each T0 counter is calibrated using the 1 and 2 MIP peaks (and sometime the 3 MIP peak) in the pedestal subtracted spectrum. The gains were normalized such that in each spectrum there are 500 channels per MIP. The calibration data are summarized in the table below.
|
Counter
|
1 MIP
|
2 MIPs
|
3 MIPs
|
Gain (1 MIP = 500)
|
|
T0P0
|
813
|
1875
|
0.548
|
|
|
T0P1
|
760
|
1629
|
0.622 |
|
|
T0P2
|
925
|
1918
|
0.525
|
|
|
T0P3
|
905
|
1770
|
2587
|
0.573
|
|
T0N0
|
772
|
1606
|
2544
|
0.603
|
|
T0N1
|
849
|
1875
|
0.544
|
|
|
T0N2
|
951
|
2026
|
3010
|
0.499
|
|
T0N3
|
857
|
1733
|
2477
|
0.596
|
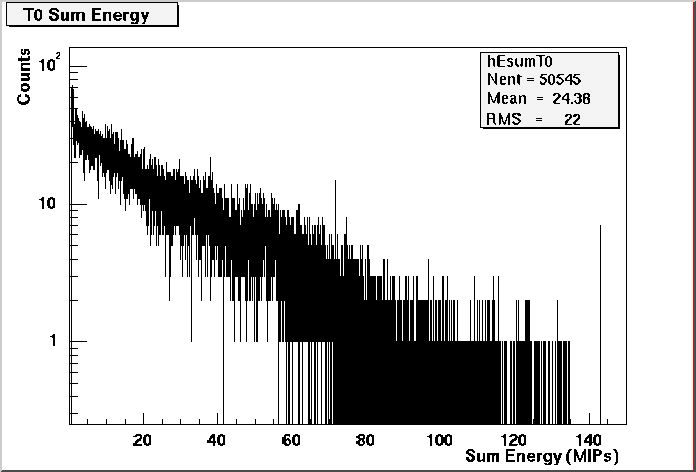
After applying gain corrections, the total sum energy can be calculated. The following histograms show the T0 sum energy spectra for all events (left-hand side) and for collision events (e->IsCollision() is true).
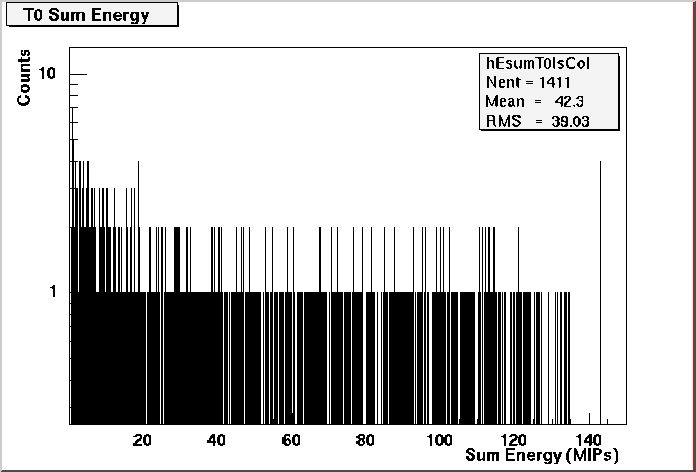
T0 sum energy spectra (in MIPs) for all events (top figure) and for collision events (bottom figure).
The average number of T0 counters that record an energy signal corresponding to 1 MIP or more is close to 5 per event for run 7310 (note that the trigger conditions for this run were such that beam-gas interactions dominated the rate). The measured multiplicity for the T0 counters in run 7310 is shown as the black histogram in the following figure.
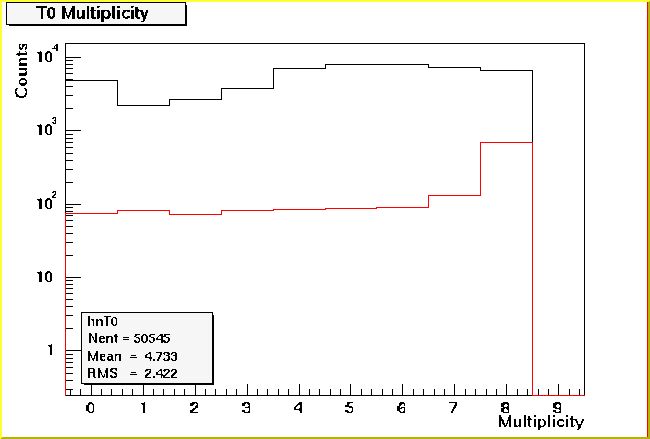
T0 multiplicity for all events in run 7310 (black histogram) and for those events for which e->IsCollision() is true (red histogram).
The T0 multiplicity for events that are tagged as collisions, based on the paddle information (e->IsCollision() is true) show a very different distribution, which is peaked at 8 (all T0 see 1 MIP or more). The T0 multiplicity distribution for collision events is shown in the previous figure by the red histogram.
The time of the negative T0 counters and the time of the positive T0 counters is defined as the shortest time measured by the 4 counters on either side. There is a strong correlation between the time measured using the negative T0 counters and the time measured using the positive T0 counters, as is demonstrated in the following figure.
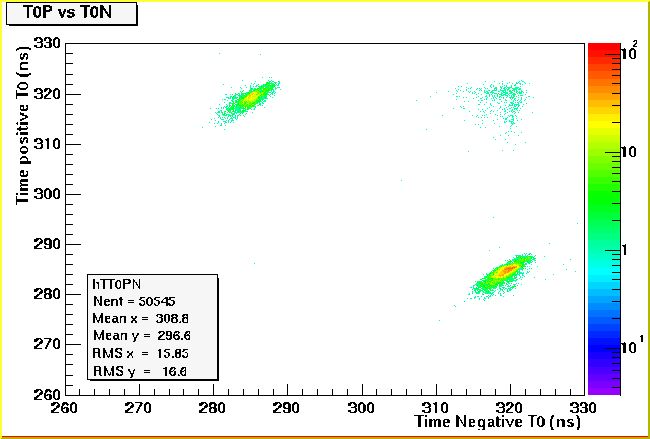
Time obtained with the positive T0 counters (in ns on the vertical axis) versus the time obtained with the negative T0 counters (in ns on the horizontal axis). The offset of the time measurement is arbitrary.
Using the time information from both negative and positive T0 counters we can calculate the time difference, which of course should be close to 0 for collisions. The time difference spectrum obtained with the T0 counters is shown in the following figure.
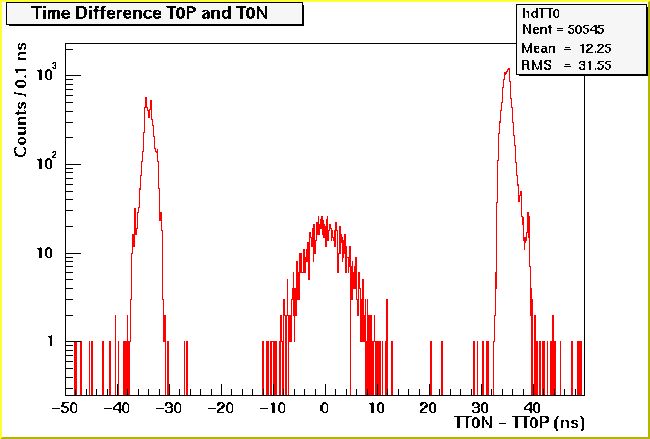
Time difference between negative and positive T0 counters (in ns).
The time difference measured with the T0 counters is strongly correlated with the time difference measured using the paddle counters. This is illustrated in the following figure where the time difference between paddle counters is shown as function of the time difference between the T0 counters.
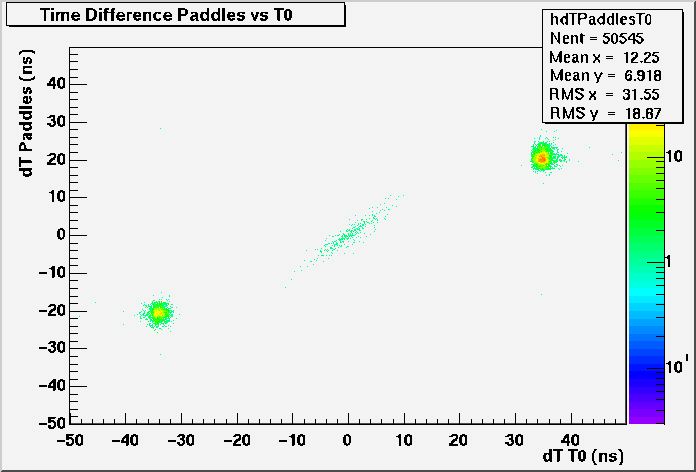
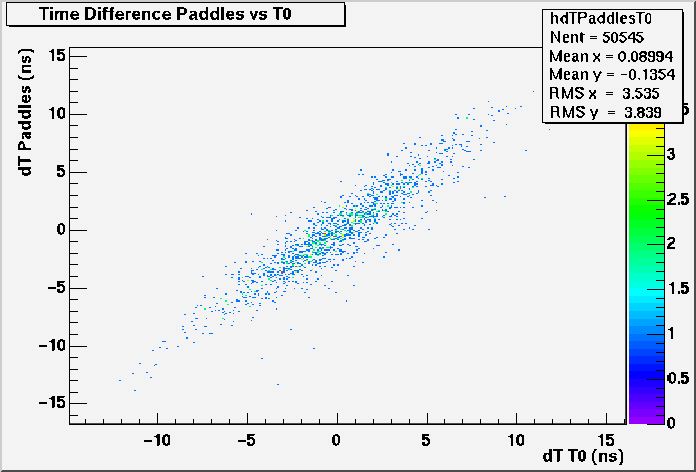
Time difference between the paddle counters (in ns on the vertical axis) versus the time difference between the T0 counters (in ns on the horizontal axis). The bottom figure is a close up of the region was collision events show up.
The right-hand figure shows a very nice correlation between the time difference measured using the paddle counters and the time difference measured using the T0 counters. Although the time difference measured by the paddles and the T0 counters are highly correlated, the paddles are more efficient to select collisions than the T0 counters are. This is illustrated in the following figure which shows the tie difference spectrum measured by the paddle counters (black histogram) and the time difference spectrum measured by the T0 counters (red histogram).
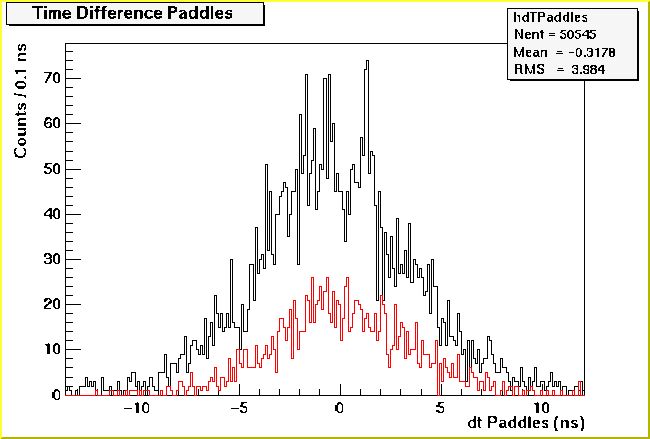
Time difference measured by the paddle counters (black histogram) and the T0 counters (red histogram) in the collision region.
In the histogram shown above, there are 4855 paddle counts and 1622 T0 counts. The difference in the number of paddle counts and T0 counts is primarily due to the events in which the energy deposition in the paddles is small. This is illustrated in the following figure which shows the time difference spectra measured by the paddles and the T0 counters, for events in which the paddle sum exceeds 5000 channels.
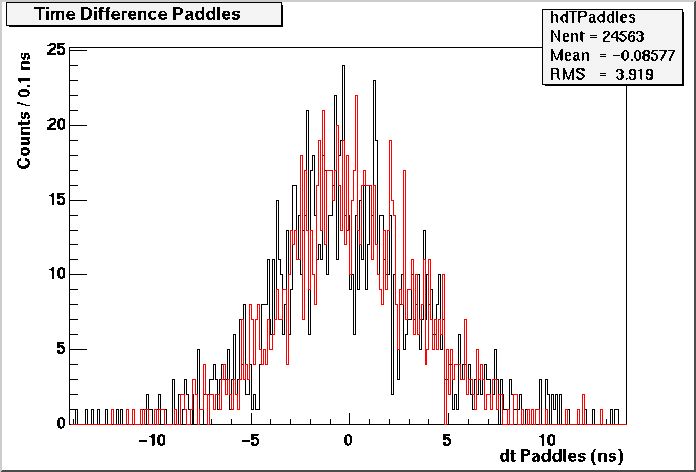
Time difference measured by the paddle counters (black histogram) and the T0 counters (red histogram) in the collision region for events where the paddle sum energy is larger than 5000 channels.
In the histogram shown above, there are 1286 paddle counts and 1267 T0 counts. This histogram suggests that the efficiency to select collision events on the basis of the information provided by the T0 counters is similar to the efficiency to select collision events on the basis of the information provided by the paddle counters, for all but the most peripheral events.
The sum energy measured by the paddles is correlated to the sum energy measured by the T0 counters. This correlation is illustrated in the following figures.
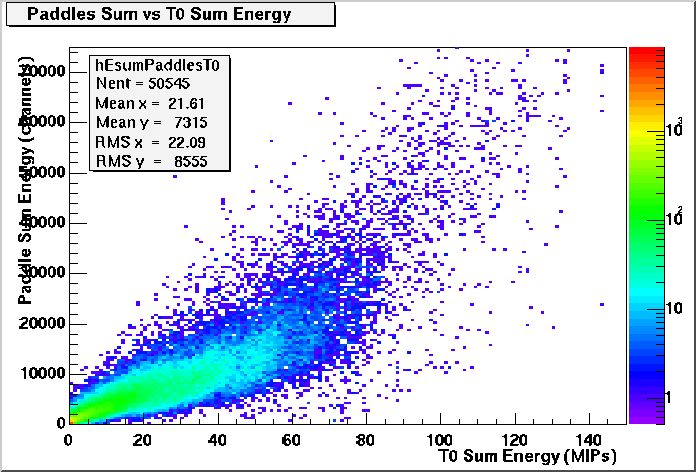
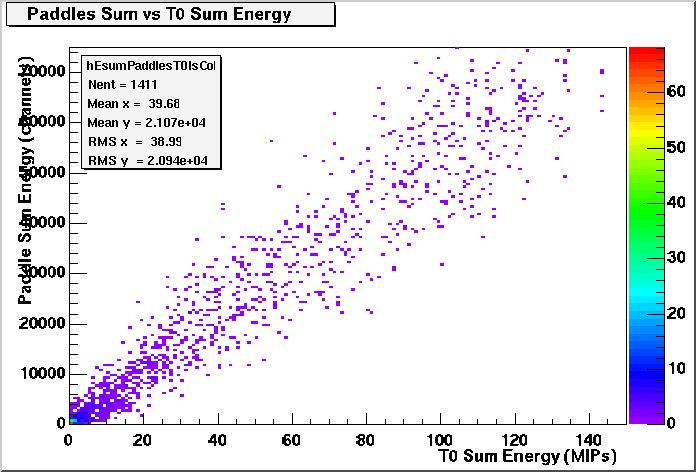
Sum energy measured with the paddle counters (in channels on vertical axis) versus sum energy measured with the T0 counters (in MIPs on the horizontal axis). The top figure shows all events, while the bottom figure shows only collision events (e->IsCollision() is true).
Although at this point the correlation seen in the spectrum on the left-hand side is not fully understood, the spectrum showing the sum energies for collision events on the right-hand side shows a very strong linear correlation between the sum energy measured with the paddles and the sum energy measured with the T0 counters. The observed correlation does not provide any evidence for a saturation in the paddle sum energy.
Bases on the analysis carried out so far we conclude that