The on-line vertex resolution has been studied as a function of the centrality of the collision. This study only looked at the resolution of the vertex extracted from the OR signals of the Cherenkov and the T0 counters. The on-line vertex resolution was extracted from the data as discussed in a previous analysis note.
The centrality was extracted from the TrgEventData in the following manner:
 	/*
	** Get centrality information for current event.
	*/
	Float_t sum = .5*(fTrgData->GetTruncMeanP()+fTrgData->GetTruncMeanN());
	Int_t bin = TPhTrgCuts::GetInstance()->GetPdlMeanBin(sum);
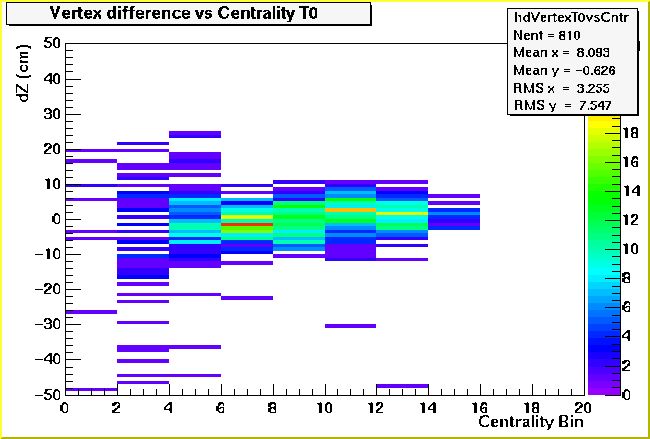
The following two Figures show the difference between the on-line vertex (obtained from the time difference between the ORs) and the vertex obtained from RMSSelVertex as function of the centrality bin for the T0 and the Cherenkov counters.
Difference between on-line T0 vertex and vertex from RMSSelVertex as function of the centrality of the collision.
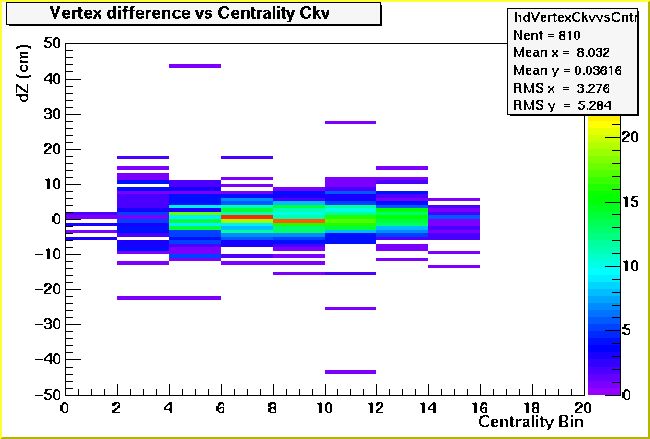
Difference between on-line Cherenkov vertex and vertex from RMSSelVertex as function of the centrality of the collision.
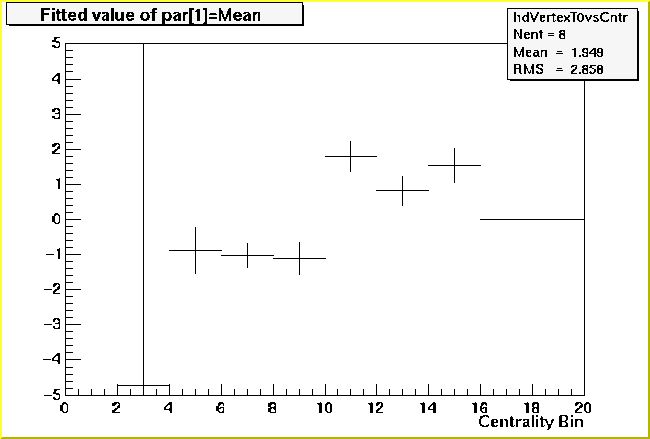
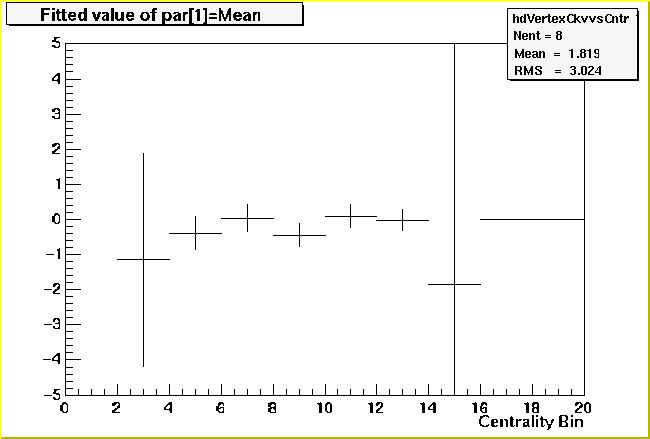
To examine the impact of centrality on the on-line vertex reconstruction, the centroid and the width of the vertex difference distributions were extracted for each centrality bin. The centroids and widths obtained in this manner for the T0 and the Cherenkov detectors are shown in the Figure below.
 |
 |
 |
 |
|
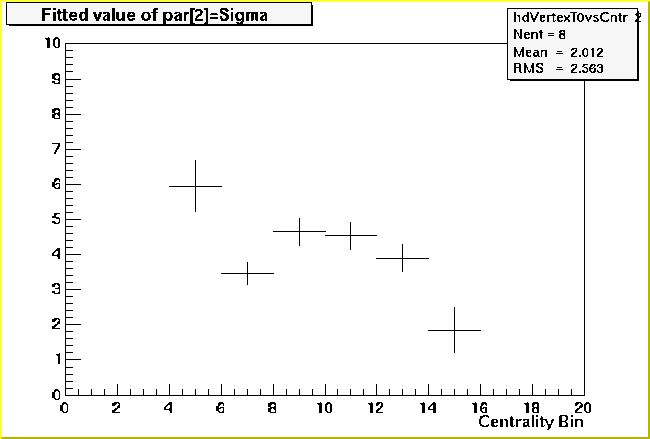
Centroid (top) and width (bottom) of the vertex difference
distributions as function of the centrality bin for the T0 counters.
|
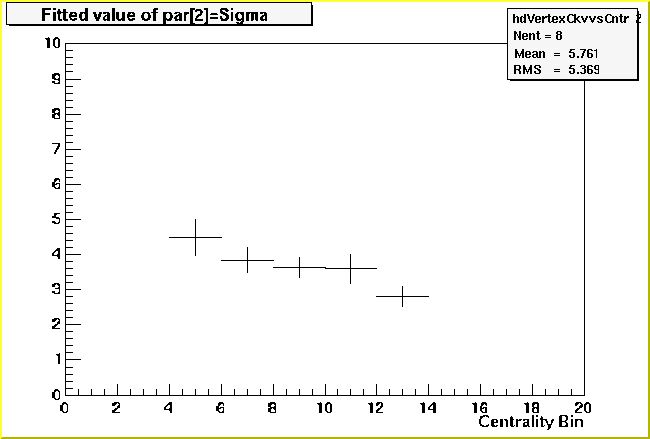
Centroid (top) and width (bottom) of the vertex difference
distributions as function of the centrality bin for the Cherenkov counters.
|
A comparison between the centrality dependence of on-line vertex reconstruction for the T0 and the Cherenkov counters shows that there appears to be a stronger centrality dependence of the reconstructed vertex position on centrality for the T0 counters. For centrality bins 4 - 9 the average reconstructed on-line vertex differs from the RMSSelVertex by -1 cm, while for bins 10-15 this difference is between +1 cm and +2 cm. The corresponding differences for the Cherenkov counters is significantly closer to 0 cm.
The difference in the centrality dependence of the T0 and the Cherenkov counters may be due to difference in signal processing:
Monte-Carlo simulations show that the number of charged particles detected in the T0 counters increases to up to 10 per collision, when going from peripheral to central collisions (see Figures below) while the number of charged particles detected in the Cherenkov counters increase only up to 2 per collision for central events. The variations in pulse height are thus a factor of 5 less for the Cherenkov counters compared to the T0 counters, and this coupled to the differences in signal processing, most likely explain the small differences observed in the vertex quality provided by the T0 and the Cherenkov counters.
Number of charged particles incident on a single counter as function of the impact parameter of the collision for the T0 counters (purple) and the Cherenkov counters. These results are obtained from Monte-Carlo simulations of 200 GeV Au + Au collisions.