Experiment Mx-01c
Simple Harmonic Motion (Computer)
Description:
In this experiment, the motion of a mass on a spring is streched gravitationally. Data
studio can be used to calculate the various energies of this system.
To carry out the measurements, follow the follwing steps.
- Load
the SHM data studio program using the link provided.
- Once
the experiment is setup, test the motion sensor to make sure that it is getting accurate readings. Make sure that the ball is always more than 40 centimeters above the motion sensor.
- Look at the graph that is being generated. If the spring is oscillating,
each of the graphs, except the total energy graph, should be oscillating.
If this is not the case, make sure the motion sensor is directly underneath
the spring since it proabably is not.
- Find the spring constant (k), mass
of the ball (m), displacement of the spring (dy) and the equilibrium distance
from the top of the sensor to the bottom of the ball (yeq).
- Once you have these
values, enter them into data studio by clicking on the calculator button
on the top of the screen next to the timer button and entering the values
on the bottom of the opened window where the constants are listed.
- When you have finished
this, pull the spring down, taking care not to stretch it too far, and release
it.
- Click on start in data studio and the program will
begin collecting data.
- To stop recording data, push
the stop button on the top of the screen.
- To see an example of what a data run will
look like, click on the link provided here.
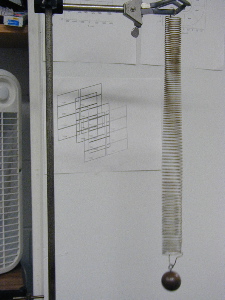
Spring
system at rest.
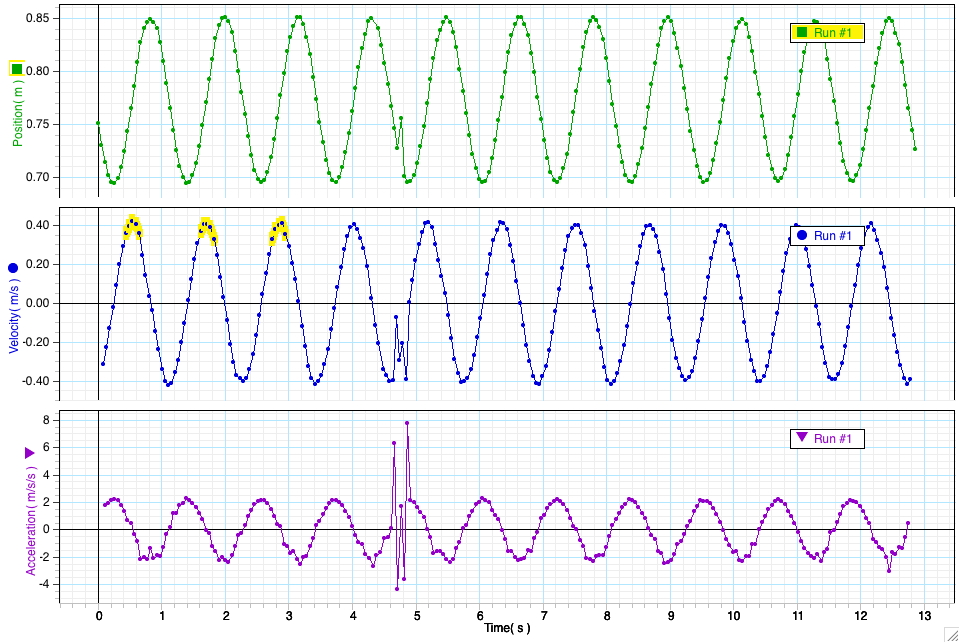
The first graph shows the
position, velocity and acceleration of the mass and spring. When the acceleration
of the system is zero, the velocity of the system has a minimum or maximum value.
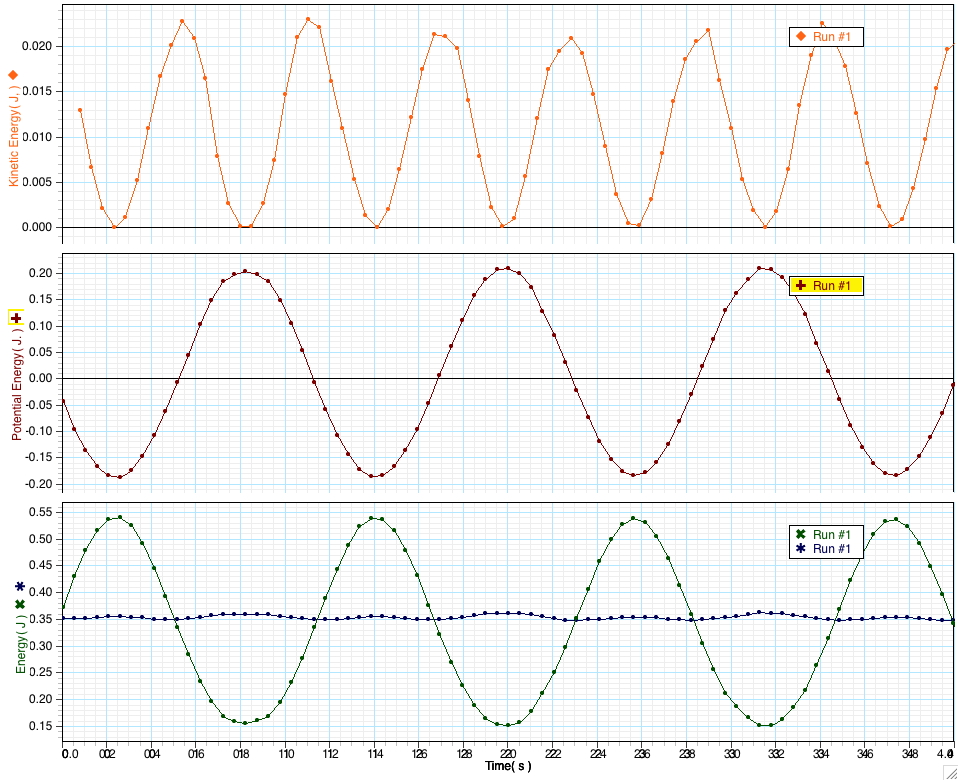
The second graph shows the different energies of the system. The sum of the kinetic
and potential energies of the system is the net energy
of the system which is constant. The net energy is represented by the blue curve
on the lowest graph.
From
top to bottom: poistion, velocity, and acceleration graphs generated
in data studio.
From
top to bottom: Kinetic energy of the ball (top), potential energy of
the ball (middle), potential energy of spring and total energy of
system (bottom).
Materials: Spring,
metal ball, motion sensor, pasco box, setup to hold spring system.
Back
to Site Menu
This page was last updated on
Tuesday August 25, 2009 10:21 AM