Experiment Mb-18cb
Measurement of 'g' (picket fence)
Description: The gravitational acceleration 'g'
can be measured using the picket fence experiment in data studio. To setup this experiment, plug
a photogate into the PASCO interface. Then open the data file provided by clicking on the link below. Click start to begin your measurements.
Drop the picket fence through the photogate. Make sure that the photogate is high
enough so that the picket fence can fall completely through it. The
picket fence must completely pass through the photogate or the measurements that
you get will not be correct. Once you are
done with a data run, the computer will calculate the acceleration and velocity
of the picket fence. It will graph the velocities and show the acceleration at
each time on a table. The program will also calculate the average acceleration
for each run. Click here for an data studio run that
has already been completed. Click here for a blank
version of the picket fence experiment.
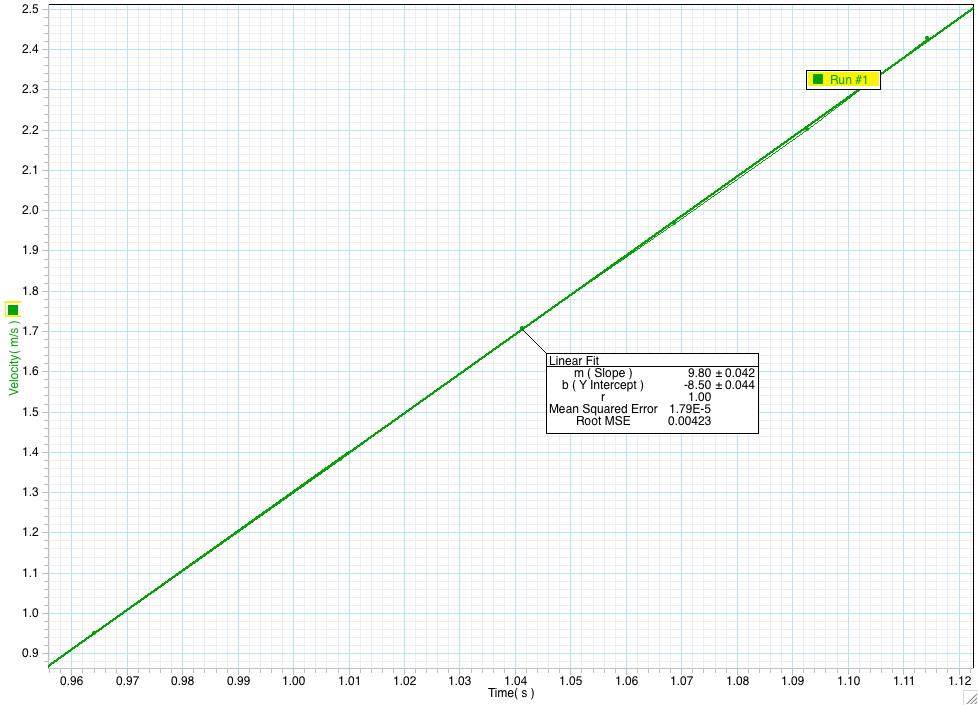
Graph
of a single data run. The acceleration obtained from these data is about 9.80m/s^2, as shown by
the slope of the line.
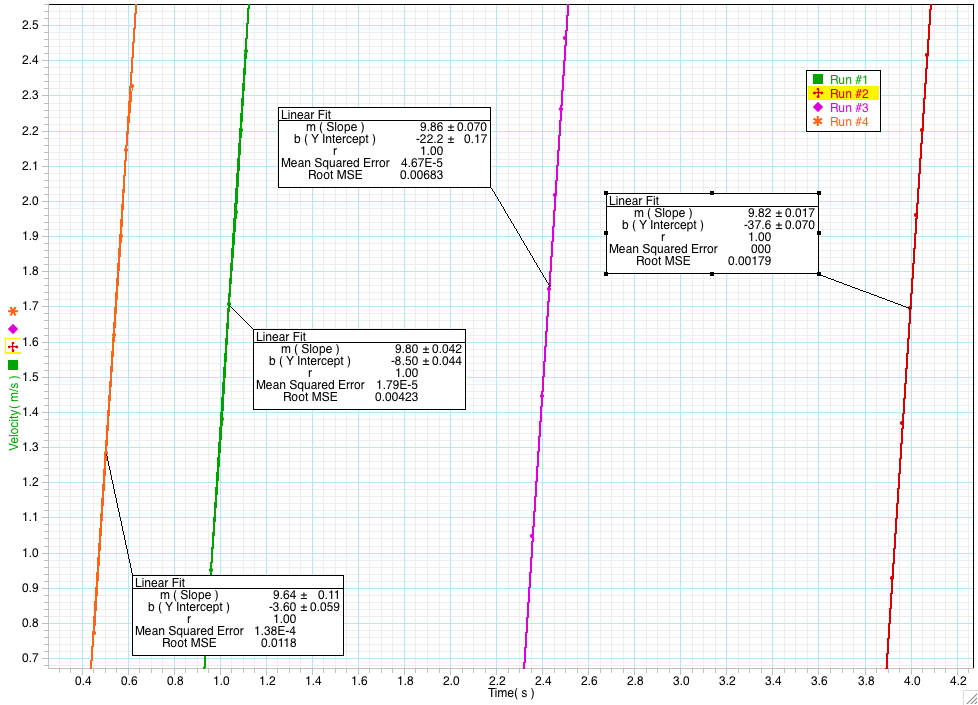
Graph
of velocities with linear fits. To make linear fits for your graph, click on
the fit button on top of the graphs and scroll down to linear fit. The slope of the line
represents the average acceleration during the run.
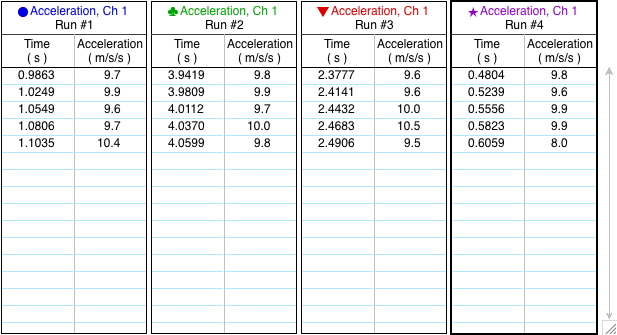
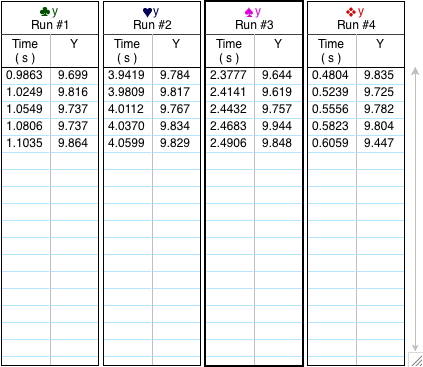
Above:
Acceleration table; below: average acceleration table.
This page was last updated on
Friday March 13, 2009 8:03 AM