Scientific
Method: theory first
February12 – February 24, 2003 PHYSICS BY INQUIRY
By: Dan Bobkoff and Kelly McNamee
Abstract
There are numerous ways to find results in science. In these experiments, we used the form of the scientific method where you verify an existing theory through experimental results. In each of the three experiments, we were given an existing formula for acceleration and using height, mass, and the difference in direction, we were able to verify the existing theory.
Theory
Scientists often formulate theories and ideas before they go into investigate something. This allows the scientists to go into an experiment with more focus. In these three experiments, we used two preexisting formulas, a=gsinq and (a=mg)/m+M where m = mass hanging off the pulley and M=mass of the cart and g=gravity. We then compared our experimental results to the results of the hypothetical theories to see if the theory has validity.
Experiment
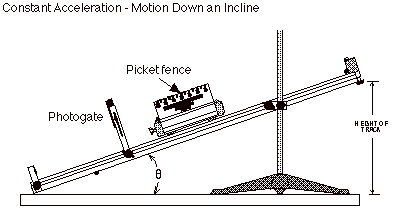
In P04, we raised the height of the track to three different heights: 12cm, 24cm, and 36cm. We then let a 496g cart down the track through a photogate. This was repeated three times to calculate error. We repeated these nine steps twice more with added mass on the cart each time.
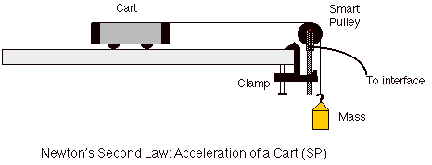
In P09, we used a smart pulley to measure the acceleration of a cart being pulled by a hanger with weight on it (see diagram below).
We kept the total mass constant, though we transferred weight from the cart to the pulley and vice-versa. We did a number of measurements. However at each weight we did three runs to calculate error.
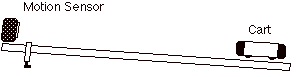
In P10, we placed a motion sensor at the top of the track and varied the height of that end of the track to create an angle. We then pushed a cart toward the motion sensor and let it fall back in the opposite direction to measure the acceleration difference between different heights of the track. The angle resulting from the flat table and angled track is equal to asin(h/l).
Data Analysis
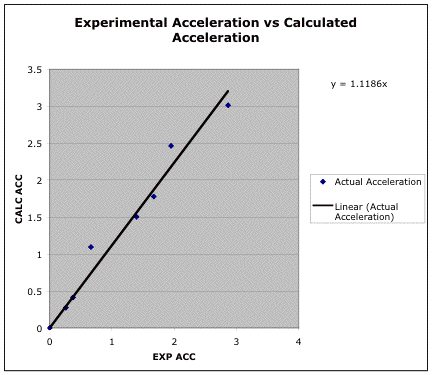
Table 1 below shows our experimental acceleration and our calculated acceleration as well as the error in the experiment in P04. In this experiment, we used the theoretical formula for acceleration a=gsinq where g=gravitational pull and sinq=height of track/length of track. We found the calculated acceleration by simply plugging in the height of the track/length of the track multiplied by gravity (9.8 m/s2). Chart 1 shows the relationship between the experimental results versus the calculated results and the slope of the line. The slope y=1.3111x proves to us that theoretical formula is true. In a perfect world, the result would be y=x, but if you look at our error analysis, the data is extremely close.
TABLE 1
|
Exp acc (m/s/s) |
Calc acc (m/s/s) |
Error of experimental |
|
0.69166667 |
0.96790123 |
0.1065 |
|
1.57933333 |
1.93580247 |
0.3755 |
|
2.003 |
2.9037037 |
0.397 |
|
0.713 |
0.96790123 |
0.1205 |
|
1.68533333 |
1.93580247 |
0.2155 |
|
2.30533333 |
2.9037037 |
0.73 |
|
0.691 |
0.96790123 |
0.0755 |
|
1.51966667 |
1.93580247 |
0.197 |
|
2.079 |
2.9037037 |
0.384 |
CHART 1
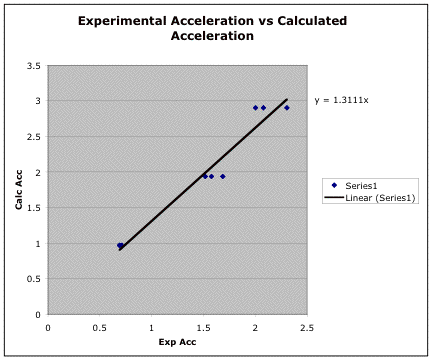
CHART2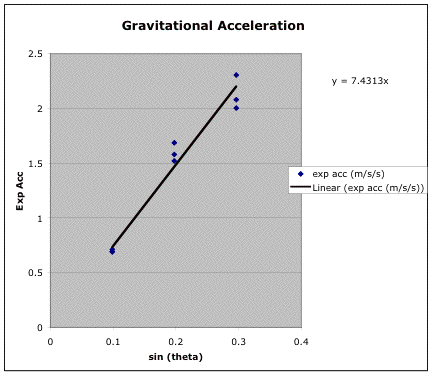
In P09, like in P04, the following table and graph show the relationship between calculated acceleration and experimental acceleration. However, we used a different formula which took into account the mass of the cart and mass of the pulley.
TABLE 2
|
Experimental
Acceleration |
Calculated Acceleration |
Error of Experimental
Acceleration |
|
0.25966667 |
0.27374302 |
0.038 |
|
0.37333333 |
0.41061453 |
0.064 |
|
0.663 |
1.09497207 |
1.61 |
|
1.39633333 |
1.50558659 |
0.286 |
|
1.671 |
1.77932961 |
0.026 |
|
1.94866667 |
2.46368715 |
2.5 |
|
2.86433333 |
3.01117318 |
0.016 |
|
0 |
0 |
0 |
CHART 3
P10 also works similarly. In this case we used the same formula as P04, (a=gsinq). However, we used a motion sensor and, therefore, were able to see how acceleration changed when velocity went from positive to negative. We know because of a previous theory that acceleration should be the same whether velocity is positive or negative. When velocity changes from negative to positive, the acceleration should be linear, however the mean of the acceleration in the positive region of the velocity is higher than the mean of the negative region of the change. This is because friction has an impact on the net force of the acceleration of the cart, thus slowing it down. This is shown below in chart 4.
CHART4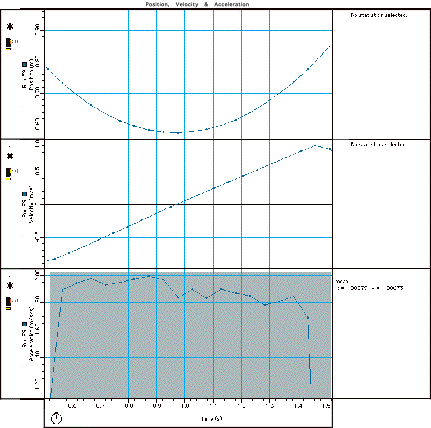
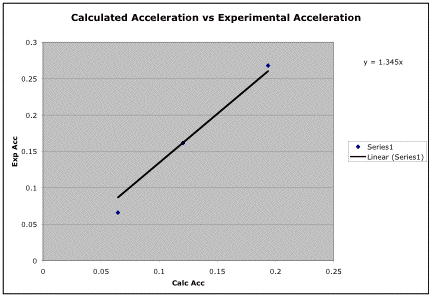
The following table and chart show, again, the calculated versus experimental accelerations. The slope is very close to one indicating vindication for our theory.
TABLE 3
|
Calculated
Acceleration |
Experimental
Acceleration |
Error of
Experimental Acceleration |
|
0.0645267 |
0.0657554 |
5.6535 |
|
0.120535 |
0.16138043 |
4.22 |
|
0.1935802 |
0.26783117 |
4.339 |
CHART 5
Conclusion
As expected, our experiments vindicated our expectations. In each case, the results of our experiments closely matched the theoretical/calculated results. In addition to this, we were also able to see how friction and human imperfection affected our results. We were able to make an educated guess at what the gravitational pull was which turned out to be close to the established number of 9.8 m/s2. While error is inevitable, one can also add and subtract the error amount from each data point on each chart to get even closer to the desired result.
Remarks
This series of experiments successfully showed the various ways one uses this form of the scientific method: a common use in the real world.