
Graphs play a crucial role in many discoveries in basic science. Graphs are used as a tool to observe correlations between various experimental parameters. The simplest correlation between two experimental parameters is the linear correlation. If 2 parameters, parameter 1 and parameter 2, have a linear correlation, their graph can be described by a straight line. The following graphs all show parameters that have a linear correlation, although the nature of the correlation is different in each case.
These graphs have the following properties:
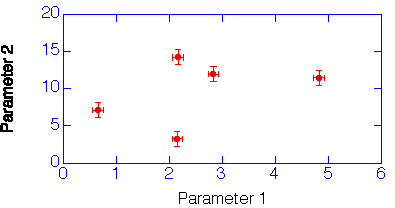
Of course, there does not always have to be a relation between two parameters. The following graph shows the results of a number of measurements which are uncorrelated.
Once a correlation is observed between parameters, the graph can be used to make predictions about the outcome of future measurements, as long as one of the two parameters is controlled by the experimenter. To get a feel for the accuracy with which you can make predictions based on an observed correlation, you can play around with the Applet below, which allows you to make predictions for different observed correlations between parameter 1 (in this case the horizontal distance x) and parameter 2 (in this case the vertical distance y).
To explore how to manipulate the parameters to be graphed in order to establish linear relations, you can carry out the following exercises.
© Frank L. H. Wolfs, University of Rochester, Rochester, NY 14627, USA
Last updated on Sunday, February 11, 2001 21:52