Simple Harmonic Motion
Mass on a Spring
Concept: harmonic motion
Time: 45 m
SW Interface: 700
Macintosh® file: P19 SHM Mass on a Spring
Windows® file: P19_MASS.SWS
EQUIPMENT NEEDED
- Science Workshop Interface
- clamp (for holding the spring)
- +/-50 Newton force sensor
- masses and mass hanger
- motion sensor
- meter stick
- balance for measuring mass
- rod (for supporting the spring)
- base and support rod
- spring (k between 2 and 4 N/m)
- clamp, right angle
PURPOSE
The purpose of this laboratory activity is to investigate the motion
of a mass oscillating on a spring.
THEORY
Imagine a spring that is hanging vertically from a support. When no mass
hangs at the end of the spring, it has a length L (called its rest length).
When a mass is added to the spring, its length increases by [Delta]L. The
equilibrium position of the mass is now a distance L + [Delta]L from the
spring's support. What happens when the mass is pulled down a small distance
from the equilibrium position? The spring exerts a restoring force, F
= -kx, where x is the distance the spring is pulled down and
k is the force constant of the spring (also called the `spring constant').
The negative sign indicates that the force points opposite to the direction
of the displacement of the mass. The restoring force causes the mass to
oscillate up and down. The period of oscillation depends on the mass and
the spring constant.

As the mass oscillates, the energy continually interchanges between kinetic
energy and some form of potential energy. If friction is ignored, the total
energy of the system remains constant. When the mass is at its highest point,
the gravitational potential energy is at its maximum. When it is at its
lowest point, the elastic potential energy is at is maximum.
INTRODUCTION
In the Pre-Lab for this activity, the force sensor will measure the force
that stretches the spring as weight is added to one end of the spring. You
will measure the amount of distance that the spring stretches. The Science
Workshop program displays the force and the distance. The slope of the best
fit line of a graph of force versus distance is the spring constant "k".
In the Procedure for this activity, the motion sensor will measure the
oscillation of the mass on the end of the spring. The Science Workshop program
displays position and velocity versus time. The program is used to determine
the period of oscillation, which is compared to the theoretical period of
oscillation.
PRE-LAB: Determining the Spring Constant
Pre-Lab Part A: Computer Setup
- Connect the Science Workshop interface to the computer, turn on the
interface, and turn on the computer.
- Connect the force sensor's DIN plug into Analog Channel A of the interface.
- Open the Science Workshop document "X19 Spring Constant"
in your handout folder. The document will open with a Graph display of
Force (Newtons) versus Stretch (m), and a Digits display of Force. The
Experiment Setup window has been resized. If you want to expand the Experiment
Setup window to its original size, click on the "Zoom" box in
the upper right hand corner of the window. (Note: To bring a display to
the top, click on its window or select the name of the display from the
list at the end of the Display menu.)
- The "Sampling Options..." are: Periodic Samples = Fast at
5 Hz, and Keyboard Sampling with Parameter = Stretch and Units = m (meters).
Pre-Lab Part B: Equipment Setup
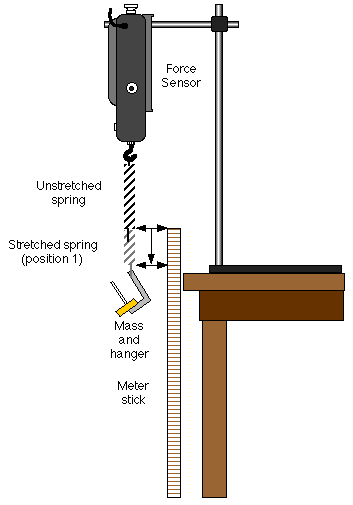
- Mount the force sensor vertically so its hook end is down.
- Suspend the spring from the force sensor's hook so that it hangs vertically.
- Use the meter stick to measure the position of the bottom end of the
spring (without any mass added to the spring). Record this measurement
as the spring's equilibrium position.
Pre-Lab Part C: Data Recording
- Click the "REC" button to begin data recording. The "Keyboard
Sampling" window will open.
- Press the tare button on the side of the force sensor to zero the force
sensor.
- For Entry #1, type in "0" (since the spring is not stretched
yet). Click "Enter" to record your value. The value you type
in will appear in the Data list in the Keyboard Sampling window.
- Add 20 grams of mass to the end of the spring (be sure to include the
mass of the hanger).
- Measure the new position of the end of the spring. Record the difference
between the new position and the equilibrium position as [Delta]x or "Stretch"
(in meters).
- For Entry #2, type in the value of [Delta]x (in meters). Click "Enter"
to record your value. The value you type in for Entry #2 will appear in
the Data list, and the default value for Entry #3 will reflect the pattern
of your first two entries.
- Add 10 grams to the spring and repeat the measurement of the new position
of the end of the spring.
- Type in the new [Delta]x as Entry #3, and click "Enter".
- Continue to add mass in 10 gram increments until you have added 70
grams. Measure the new stretched position of the end of the spring each
time you add mass. Type in each new [Delta]x in the Keyboard Sampling window.
Click "Enter" each time to record your value.
- Click the "Stop Sampling" button to end data recording. The
Keyboard Sampling window will close, and "Run #1" will appear
in the Data list in the Experiment Setup window.
Table 1: Determining the spring constant
Equilibrium Position = _______ m
| Mass (g) |
20 |
30 |
40 |
50 |
60 |
70 |
| [Delta]x, "Stretch" (m) |
|
|
|
|
|
|
Pre-Lab Part D: Analyzing the Data
- Click on the Graph to make it active. Click the "Statistics"
button to open the Statistics area. Click the "Autoscale" button
to rescale the Graph.
- Click the "Statistics Menu" button in the Statistics area.
Select "Curve Fit, Linear Fit" from the Statistics menu.
The slope of the best fit line of Force versus Stretch (coefficient "a2")
is the spring constant "k".
- Record the value of "k": Spring Constant = _________ N/m
PROCEDURE
In this part of the activity, a motion sensor will measure the motion
of a mass that is suspended from the end of the spring. The Science Workshop
program records the motion and displays position and velocity of the oscillating
mass. The period of oscillation is measured and compared to the theoretical
value.
PART I: Computer Setup
- Unplug the force sensor's DIN plug from the Science Workshop
interface.
- Connect the motion sensor's stereo phone plugs into Digital Channels
1 and 2 of the interface. Plug the yellow-banded (pulse) plug into Digital
Channel 1 and the second plug (echo) into Digital Channel 2.
- Open the Science Workshop document "P19 SHM Mass on a Spring"
located in your handout folder. An alert window appears when you select
"Open" from the File menu. Click "Don't Save" or "OK",
and then find the Science Workshop document. The document will open
with a Graph display with plots for Position (m) and Velocity (m/sec) versus
Time (sec). The Experiment Setup window has been resized. If you want to
expand the Experiment Setup window to its original size, click on the "Zoom"
box in the upper right hand corner of the window. (Note: To bring a display
to the top, click on its window or select the name of the display from
the list at the end of the Display menu.)
PART II: Sensor Calibration and Equipment Setup
- You do not need to calibrate the motion sensor.
- Using a support rod and clamp, suspend the spring so that it can move
freely up-and-down. Put a mass hanger on the end of the spring.
- Add enough mass to the hanger so that the spring's stretched length
is between 6 and 7 times its unloaded length (about 70 grams if you are
using the harmonic spring from the PASCO Introductory Dynamics System.)
- Remove the hanger and masses temporarily. Measure and record their
total mass (in kilograms) in the Data section. Return the hanger and masses
to the end of the spring.
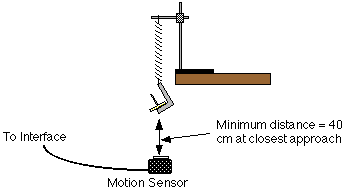
- Place the motion sensor on the floor directly beneath the mass hanger.
- Adjust the position of the spring so that the minimum distance from
the mass hanger to the motion sensor is greater than 40 cm at the bottom
of the mass hanger's movement.
PART III: Data Recording
- Pull the mass down about 20 cm and then release it. Let it oscillate
a few times to so that unwanted motion can dampen out.
- Click the "REC" button to begin recording data.
- The plots of the position and velocity of the oscillating mass will
appear in the Graph display. Continue recording for about 10 seconds.
- Click "STOP" button to end data recording. "Run #1"
will appear in the Data list in the Experiment Setup window..
Troubleshooting Note: If the data points do not appear on the
plots for position and velocity, click on the "Autoscale" button
to automatically rescale the graph. The position curve should resemble the
plot of a sine function. If it does not, check the alignment of the Motion
Sensor and the bottom of the mass hanger at the end of the spring. You may
need to increase the reflecting area of the mass hanger by attaching a circular
paper disk (about 2" diameter) to the bottom of the mass hanger. To
erase a run of data, select "Run #1" in the Data Sets list and
press the "Delete" key.
ANALYZING THE DATA
- Click the "Autoscale" button to rescale the Graph display.
- Click the "Smart Cursor" button. The cursor changes to a
cross-hair when you move it into the display area of the graph. The X-
and Y-coordinates of the cursor's position are shown next to the horizontal
and vertical axes.
- Use the Smart Cursor to find the average period of oscillation of the
mass. Move the cursor/cross-hair to the first peak in the plot of position
versus time and read the value of time (shown below the horizontal axis).
Record the value of time in the Data Table.
- Move the Smart Cursor to each consecutive peak in the plot and record
the value of time.
- Find the period of each oscillation by calculating the difference between
the time for each successive peak. Find the average of the periods. Record
your result.
- Calculate the theoretical value for the period of oscillation based
on the measured value of the spring constant of the spring and the mass
on the end of the spring. (Use mass in kilograms for this calculation).
- Mass = _________ kg.
- Calculated period of oscillation = ________ sec
DATA TABLE
| Peak # |
1 |
2 |
3 |
4 |
5 |
6 |
7 |
| Time (sec) |
|
|
|
|
|
|
|
| Period (sec) |
|
|
|
|
|
|
|
Average period of oscillation = ________ sec
QUESTIONS
- How does your calculated value for the period of oscillation compare
to the measured value for the period of oscillation? Find the percent difference
between your calculated value and the measured value. Percent difference
=

- When the position of the mass is farthest from the equilibrium position,
what is the velocity of the mass? (Hint: Move the Smart Cursor to a peak
on the position plot, hold down the Shift key, and move the Smart Cursor
onto the velocity plot. The velocity will be given next to the vertical
axis.)
- When the absolute value of the velocity of the mass is greatest, where
is the mass relative to the equilibrium position?
- Calculate the kinetic energy of the mass at various times. Calculate
the potential energy associated with the spring at various times. What
can you say about sum of this kinetic and potential energy? Is this sum
conserved?