Acceleration of a Dynamics Cart I
(Smart Pulley)
Concept: Newton's Laws
Time: 30 m
SW Interface: 700
Macintosh® file: P09 Cart Acceleration 1
Windows® file: P09_CAR1.SWS
EQUIPMENT NEEDED
- Science Workshop Interface
- mass set and mass hanger
- Smart Pulley
- string
- balance (for measuring mass)
- table clamp
- dynamics cart
- track, 1.2 meter
- graph paper
PURPOSE
In this laboratory activity, you will investigate the changes in the
motion of a dynamics cart that occur when different amounts of net force
are applied.
THEORY
Isaac Newton described the relationship of the net force applied to an
object and the acceleration it experiences in the following way: the acceleration
(a) of an object is directly proportional to and in the same direction as
the net force (Fnet), and inversely proportional to the mass (m) of the
object.

PROCEDURE
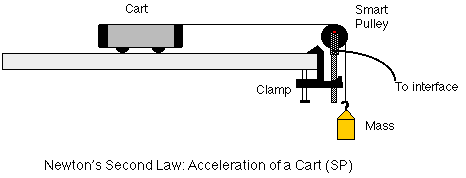
For this activity, a Smart Pulley will measure the motion of a cart as it is
pulled by a string that is attached to an object suspended over the pulley.
The Science Workshop program calculates the changing speed of the cart
as it moves. A graph of speed and time can give the acceleration of the cart.
PART I: Computer Setup
- 1. Connect the Science Workshop interface to the computer, turn on
the interface and then turn on the computer.
- Open the "P09 Cart Acceleration I" file in your handout folder.
- The document will open with a Graph display of Velocity (m/sec) versus
Time (sec).
- (Note: For quick reference, see the Experiment Notes window. To bring
a display to the top, click on its window or select the name of the display
from the list at the end of the Display menu. Change the Experiment Setup
window by clicking on the "Zoom" box or the Restore button in
the upper right hand corner of that window.)
PART II: Sensor Calibration and Equipment Setup
- If you are using a dynamics track, place the cart on the track and
level the track so the cart will not roll one way or the other on its own.
- Mount the Smart Pulley at the end of the track (or the edge of the
table).
- Attach a string to the dynamics cart. Make the string long enough so
that when the cart is next to the Smart Pulley and the string is over the
pulley, the string reaches the ground.
- Attach a mass hanger to the other end of the string.
- Put the string that connects the cart and the mass hanger over the
Smart Pulley. Adjust the Smart Pulley so that the string from the cart
is parallel to the level track or the top of the table.
- Place about 20 grams of mass on the mass hanger.
- Add about 200 grams of mass to the top of the cart.
- The applied net force is the weight of the hanger and masses (m x acceleration
due to gravity) minus friction forces.
- Measure and record the total mass of the cart (M).
- Measure and record the total mass of the mass hanger and masses (m).
PART III: Data Recording
- When you are ready to collect data, pull the cart away from the Smart Pulley
until the mass hanger almost touches the pulley.
- Turn the pulley so that the photogate beam of the Smart Pulley is "unblocked"
(the light-emitting diode (LED) on the photogate is off).
- Click the "REC" button to begin data recording.
- Release the cart so it can be pulled by the falling mass hanger. Data recording
will begin when the Smart Pulley photogate is first blocked.
- Stop the data recording just before the mass hanger reaches the floor by
clicking the "STOP" button.
- WARNING: Do not let the cart hit the Smart Pulley!
- In the Graph, click the "Statistics" button to open the Statistics
area. Click the"Autoscale" button to resize the Graph to fit the
data. Click the "Statistics Menu" button. Select "Curve Fit,
Linear Fit" from the Statistics menu.
- The "Statistics" area will show the y-intercept (a1), slope (a2),
and the quality of the fit (chi^2).
- Record the value of the slope of velocity versus time, which is the average
acceleration of the cart.
- Change the applied force (F = mg) by moving masses from the cart to the
hanger. This changes the force without changing the total mass. Measure and
record the new values for M (total mass of cart) and m (mass hanger and masses).
- Repeat the data recording steps several times. Each time, move some of the
mass from the cart to the mass hanger. Measure and record the values for M
(cart) and m (mass hanger and masses). Record the value of the slope for each
trial.
OPTIONAL
Change the total mass, yet keep the net force the same as in one of your
first trials. Add mass to the cart, keeping the hanging mass the same. Record
your new mass values, and the accelerations that you obtain. Repeat at least
five times.
ANALYZING THE DATA
- Calculate the net force acting on the cart for each trial. The net
force on the cart is the tension in the string minus the friction forces.
If friction is neglected, the net force is:

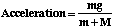
- Also calculate the total mass that is accelerated in each trial.
- Graph the acceleration versus the applied net force for cases having
the same total mass.
- Calculate the theoretical acceleration using Newton's Second Law (Fnet
= ma). Record the theoretical acceleration in the Data Table.
- Calculate the percentage difference between the actual and theoretical
accelerations. Remember,

- If you did the optional procedure, graph the acceleration versus the
total mass for cases having the same applied net force.
DATA TABLE: Acceleration of a Cart
| Trial |
M(kg) |
m(kg) |
Accel exp
(m/s^2) |
Applied Fnet (N) |
Total Mass (kg) |
Accel theory (m/s^2) |
% Difference |
| |
|
|
|
|
|
|
|
| |
|
|
|
|
|
|
|
| |
|
|
|
|
|
|
|
| |
|
|
|
|
|
|
|
| |
|
|
|
|
|
|
|
| |
|
|
|
|
|
|
|
| |
|
|
|
|
|
|
|
| |
|
|
|
|
|
|
|
| |
|
|
|
|
|
|
|
| |
|
|
|
|
|
|
|
QUESTIONS
- What relationships exist between the graphed variables?
- How does the actual acceleration compare with the theoretical acceleration?
- What is the average percentage difference between the actual and theoretical
acceleration? What are some factors that could account for this difference?
© Frank L. H.
Wolfs, University of Rochester, Rochester, NY 14627, USA
Last updated on Sunday, February 11, 2001 22:27